Cablevision 2013 Annual Report Download - page 69
Download and view the complete annual report
Please find page 69 of the 2013 Cablevision annual report below. You can navigate through the pages in the report by either clicking on the pages listed below, or by using the keyword search tool below to find specific information within the annual report.-
 1
1 -
2
-
3
-
4
-
5
-
6
-
7
-
8
-
9
-
10
-
11
-
12
-
13
-
14
-
15
-
16
-
17
-
18
-
19
-
20
-
21
-
22
-
23
-
24
-
25
-
26
-
27
-
28
-
29
-
30
-
31
-
32
-
33
-
34
-
35
-
36
-
37
-
38
-
39
-
40
-
41
-
42
-
43
-
44
-
45
-
46
-
47
-
48
-
49
-
50
-
51
-
52
-
53
-
54
-
55
-
56
-
57
-
58
-
 59
59 -
 60
60 -
 61
61 -
 62
62 -
 63
63 -
 64
64 -
 65
65 -
 66
66 -
 67
67 -
 68
68 -
 69
69 -
 70
70 -
 71
71 -
 72
72 -
 73
73 -
 74
74 -
 75
75 -
 76
76 -
 77
77 -
 78
78 -
 79
79 -
80
-
81
-
82
-
83
-
84
-
85
-
86
-
87
-
88
-
89
-
90
-
91
-
92
-
93
-
94
-
95
-
96
-
97
-
98
-
99
-
100
-
101
-
102
-
103
-
104
-
105
-
106
-
107
-
108
-
109
-
110
-
111
-
112
-
113
-
114
-
115
-
116
-
117
-
118
-
119
-
120
-
121
-
122
-
123
-
124
-
125
-
126
-
127
-
128
-
129
-
130
-
131
-
132
-
133
-
134
-
135
-
136
-
137
-
138
-
139
-
140
-
141
-
142
-
143
-
144
-
145
-
146
-
147
-
148
-
149
-
150
-
151
-
152
-
153
-
154
-
155
-
156
-
157
-
158
-
159
-
160
-
161
-
162
-
163
-
164
-
165
-
166
-
167
-
168
-
169
-
170
-
171
-
172
-
173
-
174
-
175
-
176
-
177
-
178
-
179
-
180
-
181
-
182
-
183
-
184
-
185
-
186
-
187
-
188
-
189
-
190
-
191
-
192
-
193
-
194
-
195
-
196
 |
 |

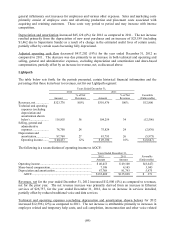
(63)
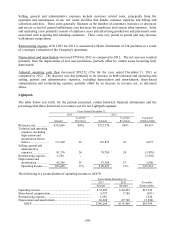
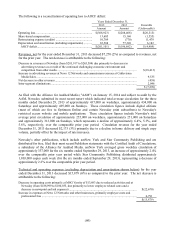
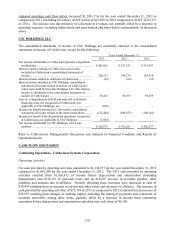
Adjusted operating cash flow decreased $418,039 (19%) for the year ended December 31, 2012 as
compared to the same period in 2011. The net decrease is attributable to the following:
Decrease in AOCF of the Cable segment (including a decrease of $105,526 related to Superstorm
Sandy) ..........................................................................................................................................
.
$(417,202)
Increase in AOCF of the Lightpath segment .....................................................................................
.
371
Decrease in AOCF of the Other segment ..........................................................................................
.
(1,208)
$(418,039)
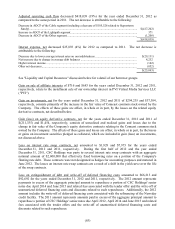
Interest expense, net decreased $25,893 (4%) for 2012 as compared to 2011. The net decrease is
attributable to the following:
Decrease due to lower average interest rates on our indebtedness ..................................................... $(29,131)
Net increase due to change in average debt balances ........................................................................ 4,232
Higher interest income.....................................................................................................................
.
(142)
Other net decreases .......................................................................................................................... (852)
$(25,893)
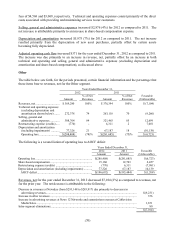
See "Liquidity and Capital Resources" discussion below for a detail of our borrower groups.
Gain on sale of affiliate interests of $716 and $683 for the years ended December 31, 2012 and 2011,
respectively, relate to the installment sale of our ownership interest in PVI Virtual Media Services LLC
("PVI").
Gain on investments, net for the years ended December 31, 2012 and 2011 of $294,235 and $37,384,
respectively, consists primarily of the increase in the fair value of Comcast common stock owned by the
Company. The effects of these gains are offset, in whole or in part, by the losses on the related equity
derivative contracts, net described below.
Gain (loss) on equity derivative contracts, net for the years ended December 31, 2012 and 2011 of
$(211,335) and $1,454, respectively, consists of unrealized and realized gains and losses due to the
change in fair value of the Company's equity derivative contracts relating to the Comcast common stock
owned by the Company. The effects of these gains and losses are offset, in whole or in part, by the losses
or gains on investment securities pledged as collateral, which are included in gain (loss) on investments,
net discussed above.
Loss on interest rate swap contracts, net amounted to $1,828 and $7,973 for the years ended
December 31, 2012 and 2011, respectively. During the first half of 2012 and the year ended
December 31, 2011, CSC Holdings was party to several interest rate swap contracts with an aggregate
notional amount of $2,600,000 that effectively fixed borrowing rates on a portion of the Company's
floating rate debt. These contracts were not designated as hedges for accounting purposes and matured in
June 2012. The losses on interest rate swap contracts are a result of a shift in the yield curve over the life
of the swap contracts.
Loss on extinguishment of debt and write-off of deferred financing costs amounted to $66,213 and
$92,692 for the years ended December 31, 2012 and 2011, respectively. The 2012 amount represents
payments in excess of the aggregate principal amount to repurchase a portion of CSC Holdings' senior
notes due April 2014 and June 2015 and related fees associated with the tender offer and the write-off of
unamortized deferred financing costs and discounts related to such repurchases. Additionally, the 2012
amount includes the write-off of deferred financing costs associated with the refinancing of the Newsday
credit facility. The 2011 amount represents amounts paid in excess of the aggregate principal amount to
repurchase a portion of CSC Holdings' senior notes due April 2012, April 2014 and June 2015 and related
fees associated with the tender offers and the write-off of unamortized deferred financing costs and
discounts related to such repurchases.