Blackberry 2012 Annual Report Download - page 91
Download and view the complete annual report
Please find page 91 of the 2012 Blackberry annual report below. You can navigate through the pages in the report by either clicking on the pages listed below, or by using the keyword search tool below to find specific information within the annual report.-
 1
1 -
2
-
3
-
4
-
5
-
6
-
7
-
8
-
9
-
10
-
11
-
12
-
13
-
14
-
15
-
16
-
17
-
18
-
19
-
20
-
21
-
22
-
23
-
24
-
25
-
26
-
27
-
28
-
29
-
30
-
31
-
32
-
33
-
34
-
35
-
36
-
37
-
38
-
39
-
40
-
41
-
42
-
43
-
44
-
45
-
46
-
47
-
48
-
49
-
50
-
51
-
52
-
53
-
54
-
55
-
56
-
57
-
58
-
59
-
60
-
61
-
62
-
63
-
64
-
65
-
66
-
67
-
68
-
69
-
70
-
71
-
72
-
73
-
74
-
75
-
76
-
77
-
78
-
79
-
80
-
 81
81 -
 82
82 -
 83
83 -
 84
84 -
 85
85 -
 86
86 -
 87
87 -
 88
88 -
 89
89 -
 90
90 -
 91
91 -
 92
92 -
 93
93 -
 94
94 -
 95
95 -
 96
96 -
 97
97 -
 98
98 -
 99
99 -
 100
100 -
 101
101 -
102
-
103
-
104
-
105
-
106
-
107
-
108
-
109
-
110
-
111
-
112
-
113
-
114
-
115
-
116
-
117
-
118
-
119
-
120
-
121
-
122
-
123
-
124
-
125
-
126
-
127
-
128
-
129
-
130
-
131
-
132
-
133
-
134
-
135
-
136
-
137
-
138
-
139
-
140
-
141
-
142
-
143
-
144
-
145
-
146
-
147
-
148
-
149
-
150
-
151
-
152
-
153
-
154
-
155
-
156
-
157
-
158
-
159
-
160
-
161
-
162
-
163
-
164
-
165
-
166
-
167
-
168
-
169
-
170
-
171
-
172
-
173
-
174
-
175
-
176
-
177
-
178
-
179
-
180
-
181
-
182
-
183
-
184
-
185
-
186
-
187
-
188
-
189
-
190
-
191
-
192
-
193
-
194
-
195
-
196
-
197
-
198
-
199
-
200
-
201
-
202
-
203
-
204
-
205
-
206
-
207
-
208
-
209
-
210
-
211
-
212
-
213
-
214
-
215
-
216
-
217
-
218
-
219
-
220
-
221
-
222
-
223
-
224
-
225
-
226
-
227
-
228
-
229
-
230
-
231
-
232
-
233
-
234
-
235
-
236
-
237
-
238
-
239
-
240
-
241
-
242
-
243
-
244
-
245
-
246
-
247
-
248
-
249
-
250
-
251
-
252
-
253
-
254
-
255
-
256
-
257
-
258
-
259
-
260
-
261
-
262
-
263
-
264
-
265
-
266
-
267
-
268
-
269
-
270
-
271
-
272
-
273
-
274
 |
 |
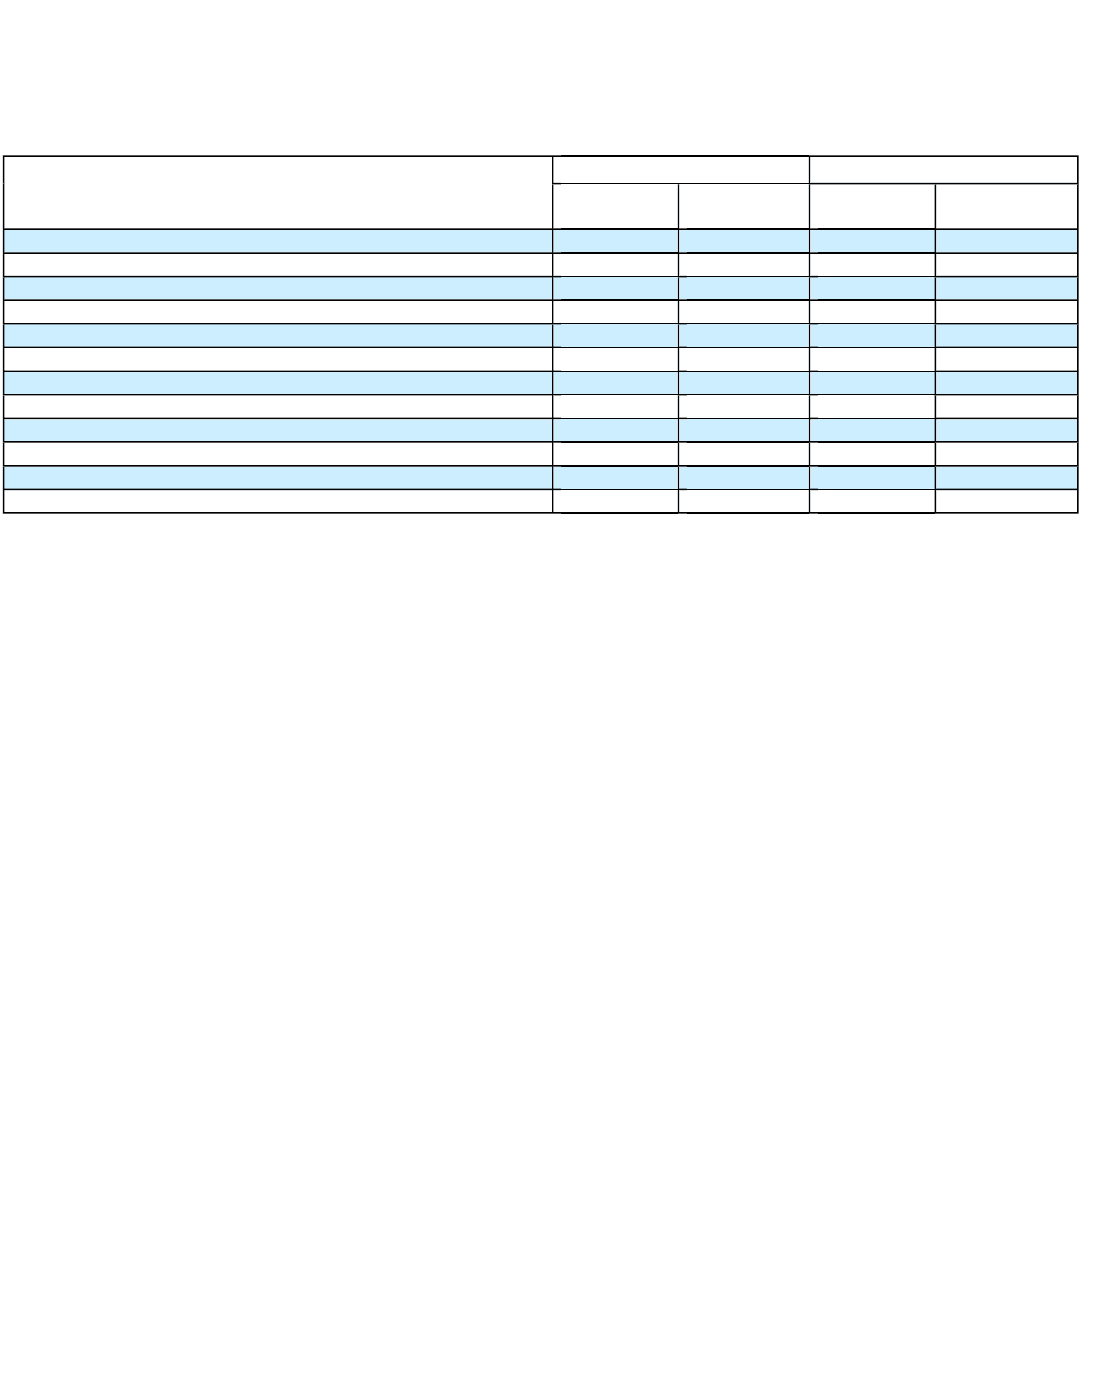
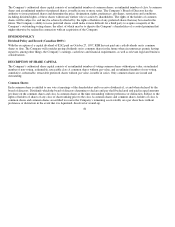
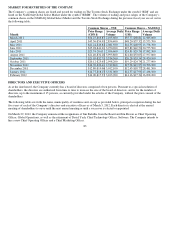
MARKET FOR SECURITIES OF THE COMPANY
The Company’s common shares are listed and posted for trading on The Toronto Stock Exchange under the symbol “RIM” and are
listed on the NASDAQ Global Select Market under the symbol “RIMM”. The volume of trading and price ranges of the Company’s
common shares on the NASDAQ Global Select Market and the Toronto Stock Exchange during the previous fiscal year are set out in
the following table:
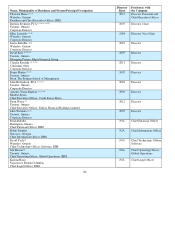
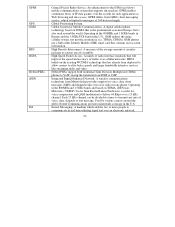
DIRECTORS AND EXECUTIVE OFFICERS
As at the date hereof, the Company currently has a board of directors comprised of ten persons. Pursuant to a special resolution of
shareholders, the directors are authorized from time to time to increase the size of the board of directors, and to fix the number of
directors, up to the maximum of 15 persons, as currently provided under the articles of the Company, without the prior consent of the
shareholders.
The following table sets forth the name, municipality of residence and, except as provided below, principal occupation during the last
five years of each of the Company’s directors and executive officers as of March 3, 2012. Each director is elected at the annual
meeting of shareholders to serve until the next annual meeting or until a successor is elected or appointed.
On March 29, 2012, the Company announced the resignations of Jim Balsillie from the Board and Jim Rowan as Chief Operating
Officer, Global Operations, as well as the retirement of David Yach, Chief Technology Officer, Software. The Company intends to
hire a new Chief Operating Officer and a Chief Marketing Officer.
83
Common Shares
–
TSX
Common Shares
–
NASDAQ
Month
Price Range
(CDN $)
Average Dail
y
Volume
Price Range
(US$)
Average Dail
y
Volume
March 2011
$54.25-$66.87
2,105,600
$55.77-$68.81
12,985,000
A
p
ril 2011
$45.56-$54.99
2,856,400
$48.20-$57.32
15,573,700
Ma
y
2011
$41.24-$46.84
2,081,500
$42.55-$48.95
13,778,700
June 2011
$25.28-$41.21
3,950,200
$25.82-$42.50
30,775,500
Jul
y
2011
$23.74-28.63
2,056,600
$24.81-$29.76
17,982,300
Au
g
ust 2011
$21.40-$32.28
3,993,800
$21.60-$33.05
27,597,800
Se
p
tember 2011
$21.05-$32.71
3,534,300
$20.28-$33.54
28,420,100
October 2011
$20.12-$25.65
2,998,200
$19.29-$24.74
21,277,000
November 2011
$16.76-$20.41
2,749,800
$15.98-$19.95
20,706,900
December 2011
$12.80-$19.06
3,012,100
$12.45-$18.77
28,481,500
Januar
y
2012
$14.77-$18.23
3,331,000
$14.57-$17.96
27,438,500
Februar
y
2012
$14.00-$17.33
3,103,900
$14.16-$17.34
16,098,200