Blackberry 2012 Annual Report Download - page 133
Download and view the complete annual report
Please find page 133 of the 2012 Blackberry annual report below. You can navigate through the pages in the report by either clicking on the pages listed below, or by using the keyword search tool below to find specific information within the annual report.-
 1
1 -
2
-
3
-
4
-
5
-
6
-
7
-
8
-
9
-
10
-
11
-
12
-
13
-
14
-
15
-
16
-
17
-
18
-
19
-
20
-
21
-
22
-
23
-
24
-
25
-
26
-
27
-
28
-
29
-
30
-
31
-
32
-
33
-
34
-
35
-
36
-
37
-
38
-
39
-
40
-
41
-
42
-
43
-
44
-
45
-
46
-
47
-
48
-
49
-
50
-
51
-
52
-
53
-
54
-
55
-
56
-
57
-
58
-
59
-
60
-
61
-
62
-
63
-
64
-
65
-
66
-
67
-
68
-
69
-
70
-
71
-
72
-
73
-
74
-
75
-
76
-
77
-
78
-
79
-
80
-
81
-
82
-
83
-
84
-
85
-
86
-
87
-
88
-
89
-
90
-
91
-
92
-
93
-
94
-
95
-
96
-
97
-
98
-
99
-
100
-
101
-
102
-
103
-
104
-
105
-
106
-
107
-
108
-
109
-
110
-
111
-
112
-
113
-
114
-
115
-
116
-
117
-
118
-
119
-
120
-
121
-
122
-
 123
123 -
 124
124 -
 125
125 -
 126
126 -
 127
127 -
 128
128 -
 129
129 -
 130
130 -
 131
131 -
 132
132 -
 133
133 -
 134
134 -
 135
135 -
 136
136 -
 137
137 -
 138
138 -
 139
139 -
 140
140 -
 141
141 -
 142
142 -
 143
143 -
144
-
145
-
146
-
147
-
148
-
149
-
150
-
151
-
152
-
153
-
154
-
155
-
156
-
157
-
158
-
159
-
160
-
161
-
162
-
163
-
164
-
165
-
166
-
167
-
168
-
169
-
170
-
171
-
172
-
173
-
174
-
175
-
176
-
177
-
178
-
179
-
180
-
181
-
182
-
183
-
184
-
185
-
186
-
187
-
188
-
189
-
190
-
191
-
192
-
193
-
194
-
195
-
196
-
197
-
198
-
199
-
200
-
201
-
202
-
203
-
204
-
205
-
206
-
207
-
208
-
209
-
210
-
211
-
212
-
213
-
214
-
215
-
216
-
217
-
218
-
219
-
220
-
221
-
222
-
223
-
224
-
225
-
226
-
227
-
228
-
229
-
230
-
231
-
232
-
233
-
234
-
235
-
236
-
237
-
238
-
239
-
240
-
241
-
242
-
243
-
244
-
245
-
246
-
247
-
248
-
249
-
250
-
251
-
252
-
253
-
254
-
255
-
256
-
257
-
258
-
259
-
260
-
261
-
262
-
263
-
264
-
265
-
266
-
267
-
268
-
269
-
270
-
271
-
272
-
273
-
274
 |
 |

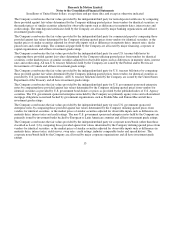
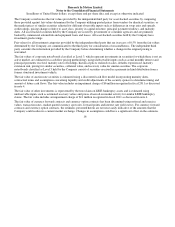
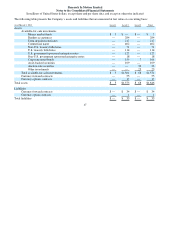
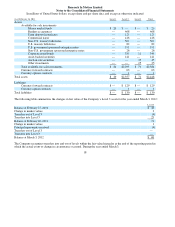
Research In Motion Limited
Notes to the Consolidated Financial Statements
In millions of United States dollars, except share and per share data, and except as otherwise indicated
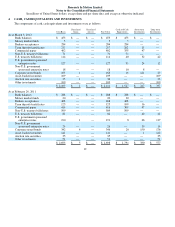
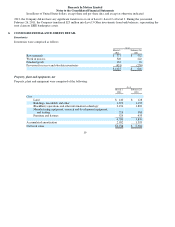
The components of cash, cash equivalents and investments were as follows:
12
4. CASH, CASH EQUIVALENTS AND INVESTMENTS
Cost Basis
Unrealized
Gains
Unrealized
Losses Fair Valu
e
Cash and Cash
Equivalents
Short-term
Investments
Long-term
Investments
As at March 3, 2012
Bank balances
$ 453
$
—
$
—
$ 453
$453
$
—
$
—
Mone
y
market funds
5
—
—
5
5
—
—
Bankers acce
p
tances
284
—
—
284
284
—
—
Term de
p
osits/certificates
217
—
—
217
202
15
—
Commercial
p
a
p
er
402
—
—
402
355
47
—
Non-U.S. treasur
y
bills/notes
71
—
—
71
71
—
—
U.S. treasur
y
bills/notes
114
—
—
114
40
32
42
U.S. government sponsored
enter
p
rise notes
127
—
—
127
91
24
12
Non-U.S. government
s
p
onsored enter
p
rise notes
18
—
—
18
10
8
—
Cor
p
orate notes/bonds
165
1
—
166
16
121
29
Asset-backed securities
109
—
—
109
—
—
109
Auction rate securities
35
1
—
36
—
—
36
Other investments
109
—
—
109
—
—
109
$2,109
$ 2
$
—
$2,111
$1,527
$247
$337
As at Februar
y
26, 2011
Bank balances
$288
$
—
$
—
$288
$288
$
—
$
—
Mone
y
market funds
2
0
—
—
2
0
20
—
—
Bankers acce
p
tances
468
—
—
468
468
—
—
Term de
p
osits/certificates
125
—
—
125
109
16
—
Commercial
p
a
p
er
416
—
—
416
369
47
—
Non-U.S. treasur
y
bills/notes
509
—
—
509
509
—
—
U.S. treasur
y
bills/notes
82
—
—
82
—
40
42
U.S. government sponsored
enter
p
rise notes
19
0
1
—
191
8
66
117
Non-U.S. government
s
p
onsored enter
p
rise notes
26
—
—
26
—
10
16
Cor
p
orate notes/bonds
342
4
—
346
20
150
176
Asset-backed securities
141
—
—
141
—
1
140
Auction rate securities
35
—
—
35
—
—
35
Other investments
51
—
—
51
—
—
51
$ 2,693
$5
$
—
$ 2,698
$ 1,791
$330
$577