Blackberry 2012 Annual Report Download - page 139
Download and view the complete annual report
Please find page 139 of the 2012 Blackberry annual report below. You can navigate through the pages in the report by either clicking on the pages listed below, or by using the keyword search tool below to find specific information within the annual report.-
 1
1 -
2
-
3
-
4
-
5
-
6
-
7
-
8
-
9
-
10
-
11
-
12
-
13
-
14
-
15
-
16
-
17
-
18
-
19
-
20
-
21
-
22
-
23
-
24
-
25
-
26
-
27
-
28
-
29
-
30
-
31
-
32
-
33
-
34
-
35
-
36
-
37
-
38
-
39
-
40
-
41
-
42
-
43
-
44
-
45
-
46
-
47
-
48
-
49
-
50
-
51
-
52
-
53
-
54
-
55
-
56
-
57
-
58
-
59
-
60
-
61
-
62
-
63
-
64
-
65
-
66
-
67
-
68
-
69
-
70
-
71
-
72
-
73
-
74
-
75
-
76
-
77
-
78
-
79
-
80
-
81
-
82
-
83
-
84
-
85
-
86
-
87
-
88
-
89
-
90
-
91
-
92
-
93
-
94
-
95
-
96
-
97
-
98
-
99
-
100
-
101
-
102
-
103
-
104
-
105
-
106
-
107
-
108
-
109
-
110
-
111
-
112
-
113
-
114
-
115
-
116
-
117
-
118
-
119
-
120
-
121
-
122
-
123
-
124
-
125
-
126
-
127
-
128
-
 129
129 -
 130
130 -
 131
131 -
 132
132 -
 133
133 -
 134
134 -
 135
135 -
 136
136 -
 137
137 -
 138
138 -
 139
139 -
 140
140 -
 141
141 -
 142
142 -
 143
143 -
 144
144 -
 145
145 -
 146
146 -
 147
147 -
 148
148 -
 149
149 -
150
-
151
-
152
-
153
-
154
-
155
-
156
-
157
-
158
-
159
-
160
-
161
-
162
-
163
-
164
-
165
-
166
-
167
-
168
-
169
-
170
-
171
-
172
-
173
-
174
-
175
-
176
-
177
-
178
-
179
-
180
-
181
-
182
-
183
-
184
-
185
-
186
-
187
-
188
-
189
-
190
-
191
-
192
-
193
-
194
-
195
-
196
-
197
-
198
-
199
-
200
-
201
-
202
-
203
-
204
-
205
-
206
-
207
-
208
-
209
-
210
-
211
-
212
-
213
-
214
-
215
-
216
-
217
-
218
-
219
-
220
-
221
-
222
-
223
-
224
-
225
-
226
-
227
-
228
-
229
-
230
-
231
-
232
-
233
-
234
-
235
-
236
-
237
-
238
-
239
-
240
-
241
-
242
-
243
-
244
-
245
-
246
-
247
-
248
-
249
-
250
-
251
-
252
-
253
-
254
-
255
-
256
-
257
-
258
-
259
-
260
-
261
-
262
-
263
-
264
-
265
-
266
-
267
-
268
-
269
-
270
-
271
-
272
-
273
-
274
 |
 |

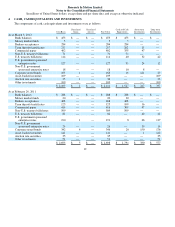
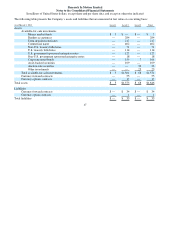
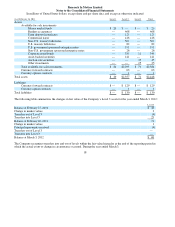
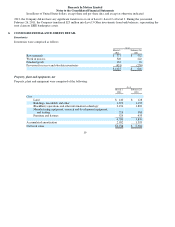
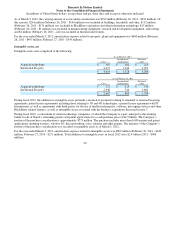
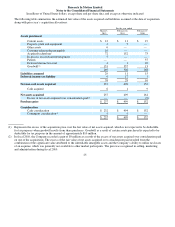
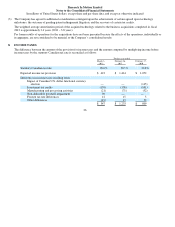
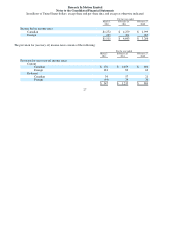
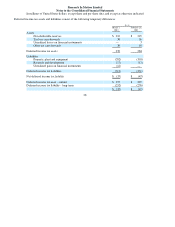
Research In Motion Limited
Notes to the Consolidated Financial Statements
In millions of United States dollars, except share and per share data, and except as otherwise indicated
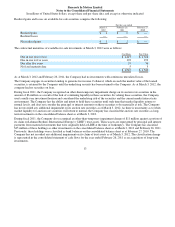
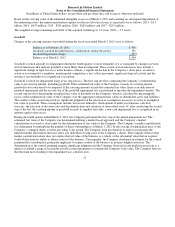
The following table summarizes the changes in fair value of the Company’s Level 3 assets for the year ended March 3, 2012:
The Company recognizes transfers into and out of levels within the fair value hierarchy at the end of the reporting period in
which the actual event or change in circumstance occurred. During the year ended March 3,
18
As at February 26, 2011 Level 1 Level 2 Level 3 Total
Assets
Available-for-sale investments
Mone
y
market funds
$20
$
—
$
—
$ 2
0
Bankers acce
p
tances
—
468
—
468
Term de
p
osits/certificates
—
125
—
125
Commercial
p
a
p
er
—
416
—
416
Non-U.S. treasur
y
bills/notes
—
509
—
509
U.S. treasur
y
bills/notes
—
82
—
82
U.S.
g
overnment s
p
onsored enter
p
rise notes
—
191
—
191
Non-U.S.
g
overnment s
p
onsored enter
p
rise notes
—
26
—
26
Cor
p
orate notes/bonds
—
335
11
346
Asset-backed securities
—
141
—
141
Auction-rate securities
—
—
35
35
Other investments
—
—
25
25
Total available-for-sale investments
$20
$2,293
$71
$2,384
Currenc
y
forward contracts
—
63
—
63
Currenc
y
o
p
tions contracts
—
1
—
1
Total assets
$20
$2,357
$71
$2,448
Liabilities
Currenc
y
forward contracts
$
—
$ 129
$
—
$ 129
Currenc
y
o
p
tion contracts
—
1
—
1
Total liabilities
$
—
$ 130
$
—
$13
0
Level 3
Balance at February 27, 2010
$48
Chan
g
e in market values
2
Transfers out of Level 3
(4)
Transfers into Level 3
25
Balance at Februar
y
26, 2011
71
Chan
g
e in market values
1
Princi
p
al re
p
a
y
ments received
(4)
Transfers out of Level 3
—
Transfers into Level 3
—
Balance at March 3, 2012
$68