Blackberry 2012 Annual Report Download - page 119
Download and view the complete annual report
Please find page 119 of the 2012 Blackberry annual report below. You can navigate through the pages in the report by either clicking on the pages listed below, or by using the keyword search tool below to find specific information within the annual report.-
 1
1 -
 2
2 -
 3
3 -
 4
4 -
 5
5 -
 6
6 -
 7
7 -
 8
8 -
 9
9 -
 10
10 -
 11
11 -
 12
12 -
 13
13 -
 14
14 -
 15
15 -
 16
16 -
 17
17 -
 18
18 -
 19
19 -
 20
20 -
 21
21 -
 22
22 -
 23
23 -
 24
24 -
 25
25 -
 26
26 -
 27
27 -
 28
28 -
 29
29 -
 30
30 -
 31
31 -
 32
32 -
 33
33 -
 34
34 -
 35
35 -
 36
36 -
 37
37 -
 38
38 -
 39
39 -
 40
40 -
 41
41 -
 42
42 -
 43
43 -
 44
44 -
 45
45 -
 46
46 -
 47
47 -
 48
48 -
 49
49 -
 50
50 -
 51
51 -
 52
52 -
 53
53 -
 54
54 -
 55
55 -
 56
56 -
 57
57 -
 58
58 -
 59
59 -
 60
60 -
 61
61 -
 62
62 -
 63
63 -
 64
64 -
 65
65 -
 66
66 -
 67
67 -
 68
68 -
 69
69 -
 70
70 -
 71
71 -
 72
72 -
 73
73 -
 74
74 -
 75
75 -
 76
76 -
 77
77 -
 78
78 -
 79
79 -
 80
80 -
 81
81 -
 82
82 -
 83
83 -
 84
84 -
 85
85 -
 86
86 -
 87
87 -
 88
88 -
 89
89 -
 90
90 -
 91
91 -
 92
92 -
 93
93 -
 94
94 -
 95
95 -
 96
96 -
 97
97 -
 98
98 -
 99
99 -
 100
100 -
 101
101 -
 102
102 -
 103
103 -
 104
104 -
 105
105 -
 106
106 -
 107
107 -
 108
108 -
 109
109 -
 110
110 -
 111
111 -
 112
112 -
 113
113 -
 114
114 -
 115
115 -
 116
116 -
 117
117 -
 118
118 -
 119
119 -
 120
120 -
 121
121 -
 122
122 -
 123
123 -
 124
124 -
 125
125 -
 126
126 -
 127
127 -
 128
128 -
 129
129 -
 130
130 -
 131
131 -
 132
132 -
 133
133 -
 134
134 -
 135
135 -
 136
136 -
 137
137 -
 138
138 -
 139
139 -
 140
140 -
 141
141 -
 142
142 -
 143
143 -
 144
144 -
 145
145 -
 146
146 -
 147
147 -
 148
148 -
 149
149 -
 150
150 -
 151
151 -
 152
152 -
 153
153 -
 154
154 -
 155
155 -
 156
156 -
 157
157 -
 158
158 -
 159
159 -
 160
160 -
 161
161 -
 162
162 -
 163
163 -
 164
164 -
 165
165 -
 166
166 -
 167
167 -
 168
168 -
 169
169 -
 170
170 -
 171
171 -
 172
172 -
 173
173 -
 174
174 -
 175
175 -
 176
176 -
 177
177 -
 178
178 -
 179
179 -
 180
180 -
 181
181 -
 182
182 -
 183
183 -
 184
184 -
 185
185 -
 186
186 -
 187
187 -
 188
188 -
 189
189 -
 190
190 -
 191
191 -
 192
192 -
 193
193 -
 194
194 -
 195
195 -
 196
196 -
 197
197 -
 198
198 -
 199
199 -
 200
200 -
 201
201 -
 202
202 -
 203
203 -
 204
204 -
 205
205 -
 206
206 -
 207
207 -
 208
208 -
 209
209 -
 210
210 -
 211
211 -
 212
212 -
 213
213 -
 214
214 -
 215
215 -
 216
216 -
 217
217 -
 218
218 -
 219
219 -
 220
220 -
 221
221 -
 222
222 -
 223
223 -
 224
224 -
 225
225 -
 226
226 -
 227
227 -
 228
228 -
 229
229 -
 230
230 -
 231
231 -
 232
232 -
 233
233 -
 234
234 -
 235
235 -
 236
236 -
 237
237 -
 238
238 -
 239
239 -
 240
240 -
 241
241 -
 242
242 -
 243
243 -
 244
244 -
 245
245 -
 246
246 -
 247
247 -
 248
248 -
 249
249 -
 250
250 -
 251
251 -
 252
252 -
 253
253 -
 254
254 -
 255
255 -
 256
256 -
 257
257 -
 258
258 -
 259
259 -
 260
260 -
 261
261 -
 262
262 -
 263
263 -
 264
264 -
 265
265 -
 266
266 -
 267
267 -
 268
268 -
 269
269 -
 270
270 -
 271
271 -
 272
272 -
 273
273 -
 274
274
 |
 |

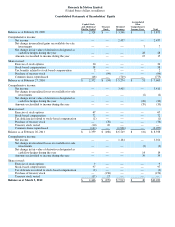
Research In Motion Limited
(United States dollars, in millions)
Consolidated Statements of Shareholders’ Equity
Capital Stock
and Additional
Paid-In Capital
Treasury
Stock
Retained
Earnings
Accumulated
Other
Comprehensive
Income (Loss) Total
Balance as at February 28, 2009
$2,328
$
—
$3,546
$ 1
$5,875
Com
p
rehensive income:
Net income
—
—
2,457
—
2,457
Net change in unrealized gains on available-for-sale
investments
—
—
—
7
7
Net change in fair value of derivatives designated as
cash flow hed
g
es durin
g
the
y
ear
—
—
—
28
28
Amounts reclassified to income durin
g
the
y
ear
—
—
—
15
15
Shares issued:
Exercise of stock o
p
tions
30
—
—
—
30
Stoc
k
-based com
p
ensation
58
—
—
—
58
Tax benefits related to stoc
k
-based com
p
ensation
2
—
—
—
2
Purchase of treasur
y
stoc
k
—
(94)
—
—
(94)
Common shares re
p
urchased
(46)
—
(729)
—
(775)
Balance as at Februar
y
27, 2010
$2,372 $ (94) $5,274
$51
$7,603
Com
p
rehensive income:
Net income
—
—
3,411
—
3,411
Net change in unrealized losses on available-for-sale
investments
—
—
—
(2)
(2)
Net change in fair value of derivatives designated as
cash flow hed
g
es durin
g
the
y
ear
—
—
—
(20)
(20)
Amounts reclassified to income durin
g
the
y
ear
—
—
—
(39)
(39)
Shares issued:
Exercise of stock o
p
tions
67
—
—
—
67
Stoc
k
-based com
p
ensation
72
—
—
—
72
Tax deficiencies related to stoc
k
-based com
p
ensation
(1)
—
—
—
(1)
Purchase of treasur
y
stoc
k
—
(76)
—
—
(76)
Treasur
y
stock vested
(10)
1
0
—
—
—
Common shares re
p
urchased
(141)
—
(1,936)
—
(2,077)
Balance as at Februar
y
26, 2011
$ 2,359
$(16
0
)
$ 6,749
$ (10)
$ 8,938
Com
p
rehensive income:
Net income
—
—
1,164
—
1,164
Net change in unrealized losses on available-for-sale
investments
—
—
—
(3)
(3)
Net change in fair value of derivatives designated as
cash flow hed
g
es durin
g
the
y
ear
—
—
—
14
14
Amounts reclassified to income durin
g
the
y
ear
—
—
—
39
39
Shares issued:
Exercise of stock o
p
tions
9
—
—
—
9
Stoc
k
-based com
p
ensation
97
—
—
—
97
Tax deficiencies related to stoc
k
-based com
p
ensation
(2)
—
—
—
(2)
Purchase of treasur
y
stoc
k
—
(156)
—
—
(156)
Treasur
y
stock vested
(17)
17
—
—
—
Balance as at March 3, 2012
$ 2,446
$ (299)
$ 7,913
$ 40
$10,100
