Blackberry 2012 Annual Report Download - page 178
Download and view the complete annual report
Please find page 178 of the 2012 Blackberry annual report below. You can navigate through the pages in the report by either clicking on the pages listed below, or by using the keyword search tool below to find specific information within the annual report.-
 1
1 -
2
-
3
-
4
-
5
-
6
-
7
-
8
-
9
-
10
-
11
-
12
-
13
-
14
-
15
-
16
-
17
-
18
-
19
-
20
-
21
-
22
-
23
-
24
-
25
-
26
-
27
-
28
-
29
-
30
-
31
-
32
-
33
-
34
-
35
-
36
-
37
-
38
-
39
-
40
-
41
-
42
-
43
-
44
-
45
-
46
-
47
-
48
-
49
-
50
-
51
-
52
-
53
-
54
-
55
-
56
-
57
-
58
-
59
-
60
-
61
-
62
-
63
-
64
-
65
-
66
-
67
-
68
-
69
-
70
-
71
-
72
-
73
-
74
-
75
-
76
-
77
-
78
-
79
-
80
-
81
-
82
-
83
-
84
-
85
-
86
-
87
-
88
-
89
-
90
-
91
-
92
-
93
-
94
-
95
-
96
-
97
-
98
-
99
-
100
-
101
-
102
-
103
-
104
-
105
-
106
-
107
-
108
-
109
-
110
-
111
-
112
-
113
-
114
-
115
-
116
-
117
-
118
-
119
-
120
-
121
-
122
-
123
-
124
-
125
-
126
-
127
-
128
-
129
-
130
-
131
-
132
-
133
-
134
-
135
-
136
-
137
-
138
-
139
-
140
-
141
-
142
-
143
-
144
-
145
-
146
-
147
-
148
-
149
-
150
-
151
-
152
-
153
-
154
-
155
-
156
-
157
-
158
-
159
-
160
-
161
-
162
-
163
-
164
-
165
-
166
-
167
-
 168
168 -
 169
169 -
 170
170 -
 171
171 -
 172
172 -
 173
173 -
 174
174 -
 175
175 -
 176
176 -
 177
177 -
 178
178 -
 179
179 -
 180
180 -
 181
181 -
 182
182 -
 183
183 -
 184
184 -
 185
185 -
 186
186 -
 187
187 -
 188
188 -
189
-
190
-
191
-
192
-
193
-
194
-
195
-
196
-
197
-
198
-
199
-
200
-
201
-
202
-
203
-
204
-
205
-
206
-
207
-
208
-
209
-
210
-
211
-
212
-
213
-
214
-
215
-
216
-
217
-
218
-
219
-
220
-
221
-
222
-
223
-
224
-
225
-
226
-
227
-
228
-
229
-
230
-
231
-
232
-
233
-
234
-
235
-
236
-
237
-
238
-
239
-
240
-
241
-
242
-
243
-
244
-
245
-
246
-
247
-
248
-
249
-
250
-
251
-
252
-
253
-
254
-
255
-
256
-
257
-
258
-
259
-
260
-
261
-
262
-
263
-
264
-
265
-
266
-
267
-
268
-
269
-
270
-
271
-
272
-
273
-
274
 |
 |

Research In Motion Limited
Management’s Discussion and Analysis of Financial Condition and Results of Operations
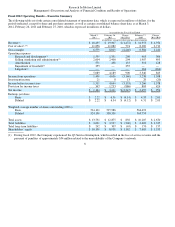
Fiscal 2012 Operating Results – Executive Summary
The following table sets forth certain consolidated statement of operations data, which is expressed in millions of dollars, for the
periods indicated, except for share and per share amounts, as well as certain consolidated balance sheet data, as at March 3,
2012, February 26, 2011 and February 27, 2010, which is expressed in millions of dollars.
8
As at and for the Fiscal Year Ended
March 3,
2012
February 26,
2011
Change
2012/2011
February 27,
2010
Change
2011/2010
(in millions, except for share and per share amounts)
Revenue
$18,435
$19,907
$(1,472)
$14,953
$4,954
Cost of sales
11,856
11,082
774
8,369
2,713
Gross mar
g
in
6,579
8,825
(2,246)
6,584
2,241
O
p
eratin
g
ex
p
enses
Research and develo
p
ment
1,559
1,351
208
965
386
Sellin
g
, marketin
g
and administration
2,604
2,400
204
1,907
493
Amortization
571
438
133
310
128
Im
p
airment of Goodwill
355
—
355
—
—
Liti
g
ation
—
—
—
164
(164)
5,089
4,189
900
3,346
843
Income from o
p
erations
1,49
0
4,636
(3,146)
3,238
1,398
Investment income
21
8
13
28
(20)
Income before income taxes
1,511
4,644
(3,133)
3,266
1,378
Provision for income taxes
347
1,233
(886)
809
424
Net income
$1,164
$3,411
$(2,247)
$2,457
$954
Earnin
g
s
p
er share
Basic
$2.22
$6.36
$(4.14)
$4.35
$2.01
Diluted
$2.22
$6.34
$ (4.12)
$4.31
$2.03
Wei
g
hted-avera
g
e number of shares outstandin
g
(00
0
’s)
Basic
524,101
535,986
564,492
Diluted
524,19
0
538,330
569,759
Total assets
$ 13,731
$12,875
$ 856
$10,205
$2,670
Total liabilities
$3,631
$3,937
$(306)
$2,602
$1,335
Total lon
g
-term liabilities
$ 242
$307
$ (65)
$170
$137
Shareholders’ e
q
uit
y
$10,10
0
$8,938
$1,162
$7,603
$1,335
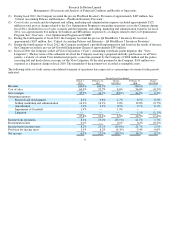
(1) During fiscal 2012, the Company experienced the Q3 Service Interruption, which resulted in the loss of service revenue and the
p
a
y
ment of
p
enalties of a
pp
roximatel
y
$54 million related to the unavailabilit
y
of the Com
p
an
y
’s network.
(1)
(2,3,4)
(3)
(3)
(5)
(6)