Blackberry 2012 Annual Report Download - page 217
Download and view the complete annual report
Please find page 217 of the 2012 Blackberry annual report below. You can navigate through the pages in the report by either clicking on the pages listed below, or by using the keyword search tool below to find specific information within the annual report.-
 1
1 -
2
-
3
-
4
-
5
-
6
-
7
-
8
-
9
-
10
-
11
-
12
-
13
-
14
-
15
-
16
-
17
-
18
-
19
-
20
-
21
-
22
-
23
-
24
-
25
-
26
-
27
-
28
-
29
-
30
-
31
-
32
-
33
-
34
-
35
-
36
-
37
-
38
-
39
-
40
-
41
-
42
-
43
-
44
-
45
-
46
-
47
-
48
-
49
-
50
-
51
-
52
-
53
-
54
-
55
-
56
-
57
-
58
-
59
-
60
-
61
-
62
-
63
-
64
-
65
-
66
-
67
-
68
-
69
-
70
-
71
-
72
-
73
-
74
-
75
-
76
-
77
-
78
-
79
-
80
-
81
-
82
-
83
-
84
-
85
-
86
-
87
-
88
-
89
-
90
-
91
-
92
-
93
-
94
-
95
-
96
-
97
-
98
-
99
-
100
-
101
-
102
-
103
-
104
-
105
-
106
-
107
-
108
-
109
-
110
-
111
-
112
-
113
-
114
-
115
-
116
-
117
-
118
-
119
-
120
-
121
-
122
-
123
-
124
-
125
-
126
-
127
-
128
-
129
-
130
-
131
-
132
-
133
-
134
-
135
-
136
-
137
-
138
-
139
-
140
-
141
-
142
-
143
-
144
-
145
-
146
-
147
-
148
-
149
-
150
-
151
-
152
-
153
-
154
-
155
-
156
-
157
-
158
-
159
-
160
-
161
-
162
-
163
-
164
-
165
-
166
-
167
-
168
-
169
-
170
-
171
-
172
-
173
-
174
-
175
-
176
-
177
-
178
-
179
-
180
-
181
-
182
-
183
-
184
-
185
-
186
-
187
-
188
-
189
-
190
-
191
-
192
-
193
-
194
-
195
-
196
-
197
-
198
-
199
-
200
-
201
-
202
-
203
-
204
-
205
-
206
-
 207
207 -
 208
208 -
 209
209 -
 210
210 -
 211
211 -
 212
212 -
 213
213 -
 214
214 -
 215
215 -
 216
216 -
 217
217 -
 218
218 -
 219
219 -
 220
220 -
 221
221 -
 222
222 -
 223
223 -
 224
224 -
 225
225 -
 226
226 -
 227
227 -
228
-
229
-
230
-
231
-
232
-
233
-
234
-
235
-
236
-
237
-
238
-
239
-
240
-
241
-
242
-
243
-
244
-
245
-
246
-
247
-
248
-
249
-
250
-
251
-
252
-
253
-
254
-
255
-
256
-
257
-
258
-
259
-
260
-
261
-
262
-
263
-
264
-
265
-
266
-
267
-
268
-
269
-
270
-
271
-
272
-
273
-
274
 |
 |

Research In Motion Limited
Management’s Discussion and Analysis of Financial Condition and Results of Operations
Cash flows for the fiscal year ended March 3, 2012
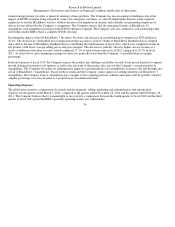
Operating Activities
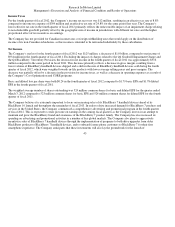
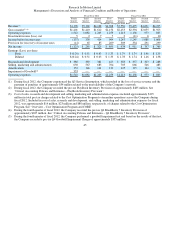
Net cash flows provided by operating activities were $2.9 billion for fiscal 2012 compared to net cash flows provided by operating
activities of $4.0 billion in fiscal 2011. The decrease in fiscal 2012 was mainly attributable to a decrease in net income, as well as net
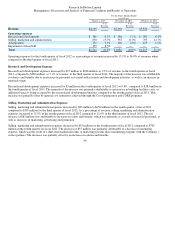
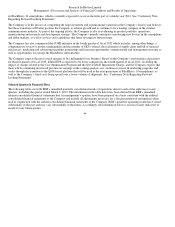
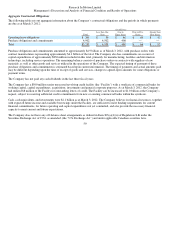
changes in working capital compared to the prior fiscal year. The table below summarizes the current assets, current liabilities, and
working capital of the Company:
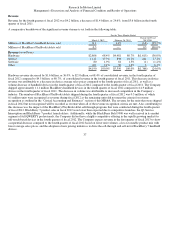
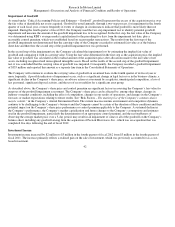
The decrease in current assets of $432 million at the end of fiscal 2012 from the end of fiscal 2011 was primarily due to a decrease in
accounts receivable of $893 million and partially offset by an increase of $409 million in inventory. At the end of fiscal 2012,
accounts receivable was approximately $3.1 billion, the decrease of $893 million is primarily due to decreased revenues, which was
partially offset by an increasing international mix of business where payment terms tend to be longer as well as the timing of
shipments in the quarter. Days sales outstanding increased to 68 days in the fourth quarter of fiscal 2012 from 65 days at the end of
fiscal 2011.
As at the end of fiscal 2012, inventory was approximately $1.0 billion; the increase of $409 million was primarily due to an increase
in the level of raw material components on hand to support upcoming product launches, an increase in certain inventory costs, as well
as lower shipments in fiscal 2012.
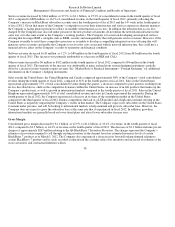
The decrease in current liabilities of $241 million at the end of fiscal 2012 from the end of fiscal 2011 was primarily due to decreases
in accrued liabilities, accounts payable and income taxes payable. As at March 3, 2012, the accrued liabilities balance was
approximately $2.4 billion, a decrease of $129 million from the end of fiscal 2011 primarily due to decreases in accrued personnel
costs, derivative liabilities, and accrued royalties.
The decrease in accounts payable of $88 million was primarily due to the timing of purchases during the fourth quarter of fiscal 2012
compared to the fourth quarter of fiscal 2011. Income taxes payable decreased by $179 million when compared to the same period in
the prior year due to a decrease in taxable income.
I
nvesting Activities
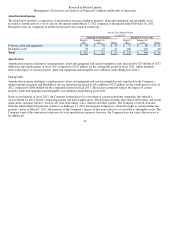
During the fiscal year ended March 3, 2012, cash flows used in investing activities were $3.0 billion and included property, plant and
equipment additions of $902 million, intangible asset additions of $2.2 billion, and business acquisitions of $226 million, offset by
cash flows provided by transactions involving the proceeds on sale or maturity of short-term investments and long-term investments,
net of the costs of acquisitions, in the amount of $321 million. For the same period of the prior fiscal year, cash flows used in
investing activities were $1.7 billion and included property, plant and equipment additions of $1.0 billion, intangible asset additions
of $557 million, and business acquisitions of $494 million, offset by cash flows provided by transactions involving the proceeds on
sale or maturity of short-term investments and long-term investments, net of the costs of acquisitions, in the amount of $392 million.
47
As at
(in millions)
March 3,
2012
February 26,
2011 Chan
g
e
Current assets
$7,056
$7,488
$(432)
Current liabilities
3,389
3,630
(241)
Workin
g
ca
p
ital
$3,667
$3,858
$(191)