Blackberry 2012 Annual Report Download - page 163
Download and view the complete annual report
Please find page 163 of the 2012 Blackberry annual report below. You can navigate through the pages in the report by either clicking on the pages listed below, or by using the keyword search tool below to find specific information within the annual report.-
 1
1 -
2
-
3
-
4
-
5
-
6
-
7
-
8
-
9
-
10
-
11
-
12
-
13
-
14
-
15
-
16
-
17
-
18
-
19
-
20
-
21
-
22
-
23
-
24
-
25
-
26
-
27
-
28
-
29
-
30
-
31
-
32
-
33
-
34
-
35
-
36
-
37
-
38
-
39
-
40
-
41
-
42
-
43
-
44
-
45
-
46
-
47
-
48
-
49
-
50
-
51
-
52
-
53
-
54
-
55
-
56
-
57
-
58
-
59
-
60
-
61
-
62
-
63
-
64
-
65
-
66
-
67
-
68
-
69
-
70
-
71
-
72
-
73
-
74
-
75
-
76
-
77
-
78
-
79
-
80
-
81
-
82
-
83
-
84
-
85
-
86
-
87
-
88
-
89
-
90
-
91
-
92
-
93
-
94
-
95
-
96
-
97
-
98
-
99
-
100
-
101
-
102
-
103
-
104
-
105
-
106
-
107
-
108
-
109
-
110
-
111
-
112
-
113
-
114
-
115
-
116
-
117
-
118
-
119
-
120
-
121
-
122
-
123
-
124
-
125
-
126
-
127
-
128
-
129
-
130
-
131
-
132
-
133
-
134
-
135
-
136
-
137
-
138
-
139
-
140
-
141
-
142
-
143
-
144
-
145
-
146
-
147
-
148
-
149
-
150
-
151
-
152
-
 153
153 -
 154
154 -
 155
155 -
 156
156 -
 157
157 -
 158
158 -
 159
159 -
 160
160 -
 161
161 -
 162
162 -
 163
163 -
 164
164 -
 165
165 -
 166
166 -
 167
167 -
 168
168 -
 169
169 -
 170
170 -
 171
171 -
 172
172 -
 173
173 -
174
-
175
-
176
-
177
-
178
-
179
-
180
-
181
-
182
-
183
-
184
-
185
-
186
-
187
-
188
-
189
-
190
-
191
-
192
-
193
-
194
-
195
-
196
-
197
-
198
-
199
-
200
-
201
-
202
-
203
-
204
-
205
-
206
-
207
-
208
-
209
-
210
-
211
-
212
-
213
-
214
-
215
-
216
-
217
-
218
-
219
-
220
-
221
-
222
-
223
-
224
-
225
-
226
-
227
-
228
-
229
-
230
-
231
-
232
-
233
-
234
-
235
-
236
-
237
-
238
-
239
-
240
-
241
-
242
-
243
-
244
-
245
-
246
-
247
-
248
-
249
-
250
-
251
-
252
-
253
-
254
-
255
-
256
-
257
-
258
-
259
-
260
-
261
-
262
-
263
-
264
-
265
-
266
-
267
-
268
-
269
-
270
-
271
-
272
-
273
-
274
 |
 |

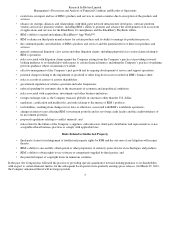
Research In Motion Limited
Notes to the Consolidated Financial Statements
In millions of United States dollars, except share and per share data, and except as otherwise indicated
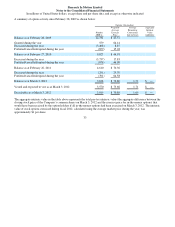
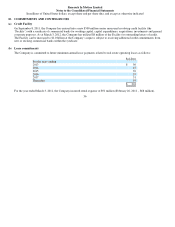
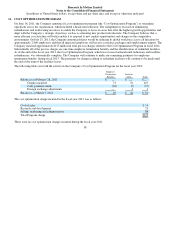
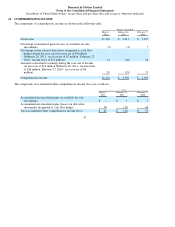
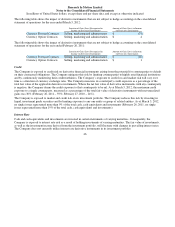
The components of unrealized gains (losses) on derivative instruments are as follows:
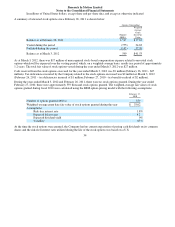
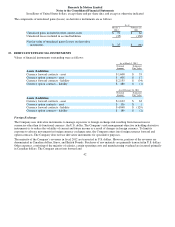
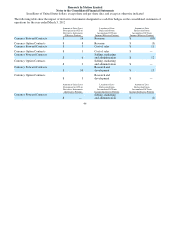
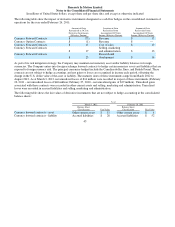
Values of financial instruments outstanding were as follows:
Foreign Exchange
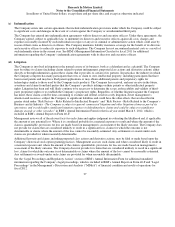
The Company uses derivative instruments to manage exposures to foreign exchange risk resulting from transactions in
currencies other than its functional currency, the U.S. dollar. The Company’s risk management objective in holding derivative
instruments is to reduce the volatility of current and future income as a result of changes in foreign currency. To limit its
exposure to adverse movements in foreign currency exchange rates, the Company enters into foreign currency forward and
option contracts. The Company does not use derivative instruments for speculative purposes.
The majority of the Company’s revenues in fiscal 2012 are transacted in U.S. dollars. However, portions of the revenues are
denominated in Canadian dollars, Euros, and British Pounds. Purchases of raw materials are primarily transacted in U.S. dollars.
Other expenses, consisting of the majority of salaries, certain operating costs and manufacturing overhead are incurred primarily
in Canadian dollars. The Company enters into forward and
42
As at
March 3,
2012
February 26,
2011
Unrealized gains included in other current assets
$72
$64
Unrealized losses included in accrued liabilities
(35)
(130)
Net fair value of unrealized gains (losses) on derivative
instruments
$37
$(66)
15. DERIVATIVE FINANCIAL INSTRUMENTS
As at March 3, 2012
Notional
Amount
Estimated
Fair Valu
e
Assets (Liabilities)
Currenc
y
forward contracts - asset
$ 1,608
$ 55
Currenc
y
o
p
tion contracts - asset
$608
$17
Currenc
y
forward contracts - liabilit
y
$ 2,155
$ (34)
Currenc
y
o
p
tion contracts - liabilit
y
$48
0
$(1)
As at Februar
y
26, 2011
Notional
Amount
Estimated
Fair Value
Assets (Liabilities)
Currenc
y
forward contracts - asset
$ 1,622
$ 63
Currenc
y
o
p
tion contracts - asset
$156
$ 1
Currenc
y
forward contracts - liabilit
y
$ 4,848
$ (129)
Currenc
y
o
p
tion contracts - liabilit
y
$18
0
$(1)