Blackberry 2012 Annual Report Download - page 167
Download and view the complete annual report
Please find page 167 of the 2012 Blackberry annual report below. You can navigate through the pages in the report by either clicking on the pages listed below, or by using the keyword search tool below to find specific information within the annual report.-
 1
1 -
2
-
3
-
4
-
5
-
6
-
7
-
8
-
9
-
10
-
11
-
12
-
13
-
14
-
15
-
16
-
17
-
18
-
19
-
20
-
21
-
22
-
23
-
24
-
25
-
26
-
27
-
28
-
29
-
30
-
31
-
32
-
33
-
34
-
35
-
36
-
37
-
38
-
39
-
40
-
41
-
42
-
43
-
44
-
45
-
46
-
47
-
48
-
49
-
50
-
51
-
52
-
53
-
54
-
55
-
56
-
57
-
58
-
59
-
60
-
61
-
62
-
63
-
64
-
65
-
66
-
67
-
68
-
69
-
70
-
71
-
72
-
73
-
74
-
75
-
76
-
77
-
78
-
79
-
80
-
81
-
82
-
83
-
84
-
85
-
86
-
87
-
88
-
89
-
90
-
91
-
92
-
93
-
94
-
95
-
96
-
97
-
98
-
99
-
100
-
101
-
102
-
103
-
104
-
105
-
106
-
107
-
108
-
109
-
110
-
111
-
112
-
113
-
114
-
115
-
116
-
117
-
118
-
119
-
120
-
121
-
122
-
123
-
124
-
125
-
126
-
127
-
128
-
129
-
130
-
131
-
132
-
133
-
134
-
135
-
136
-
137
-
138
-
139
-
140
-
141
-
142
-
143
-
144
-
145
-
146
-
147
-
148
-
149
-
150
-
151
-
152
-
153
-
154
-
155
-
156
-
 157
157 -
 158
158 -
 159
159 -
 160
160 -
 161
161 -
 162
162 -
 163
163 -
 164
164 -
 165
165 -
 166
166 -
 167
167 -
 168
168 -
 169
169 -
 170
170 -
 171
171 -
 172
172 -
 173
173 -
 174
174 -
 175
175 -
 176
176 -
 177
177 -
178
-
179
-
180
-
181
-
182
-
183
-
184
-
185
-
186
-
187
-
188
-
189
-
190
-
191
-
192
-
193
-
194
-
195
-
196
-
197
-
198
-
199
-
200
-
201
-
202
-
203
-
204
-
205
-
206
-
207
-
208
-
209
-
210
-
211
-
212
-
213
-
214
-
215
-
216
-
217
-
218
-
219
-
220
-
221
-
222
-
223
-
224
-
225
-
226
-
227
-
228
-
229
-
230
-
231
-
232
-
233
-
234
-
235
-
236
-
237
-
238
-
239
-
240
-
241
-
242
-
243
-
244
-
245
-
246
-
247
-
248
-
249
-
250
-
251
-
252
-
253
-
254
-
255
-
256
-
257
-
258
-
259
-
260
-
261
-
262
-
263
-
264
-
265
-
266
-
267
-
268
-
269
-
270
-
271
-
272
-
273
-
274
 |
 |

Research In Motion Limited
Notes to the Consolidated Financial Statements
In millions of United States dollars, except share and per share data, and except as otherwise indicated
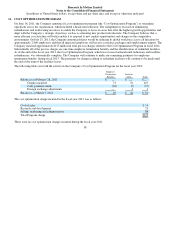
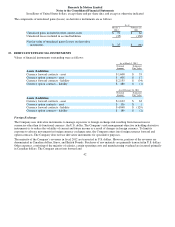
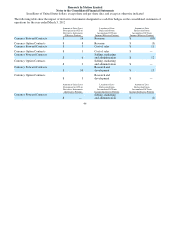
The following table shows the impact of derivative instruments that are not subject to hedge accounting on the consolidated
statement of operations for the year ended March 3, 2012:
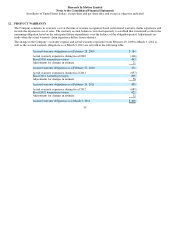
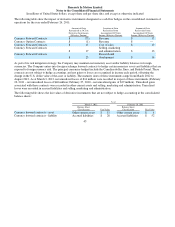
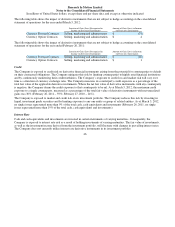
The following table shows the impact of derivative instruments that are not subject to hedge accounting on the consolidated
statement of operations for the year ended February 26, 2011:
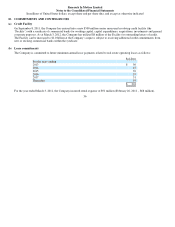
Credit
The Company is exposed to credit risk on derivative financial instruments arising from the potential for counterparties to default
on their contractual obligations. The Company mitigates this risk by limiting counterparties to highly rated financial institutions
and by continuously monitoring their creditworthiness. The Company’s exposure to credit loss and market risk will vary over
time as a function of currency exchange rates. The Company measures its counterparty credit exposure as a percentage of the
total fair value of the applicable derivative instruments. Where the net fair value of derivative instruments with any counterparty
is negative, the Company deems the credit exposure to that counterparty to be nil. As at March 3, 2012, the maximum credit
exposure to a single counterparty, measured as a percentage of the total fair value of derivative instruments with net unrealized
gains was 30% (February 26, 2011 – 59%; February 27, 2010 – 24%).
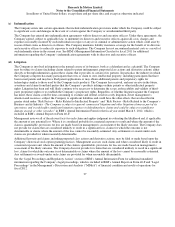
The Company is exposed to market and credit risk on its investment portfolio. The Company reduces this risk by investing in
liquid, investment grade securities and by limiting exposure to any one entity or group of related entities. As at March 3, 2012,
no single issuer represented more than 9% of the total cash, cash equivalents and investments (February 26, 2011, no single
issuer represented more than 19% of the total cash, cash equivalents and investments).
Interest Rate
Cash and cash equivalents and investments are invested in certain instruments of varying maturities. Consequently, the
Company is exposed to interest rate risk as a result of holding investments of varying maturities. The fair value of investments,
as well as the investment income derived from the investment portfolio, will fluctuate with changes in prevailing interest rates.
The Company does not currently utilize interest rate derivative instruments in its investment portfolio.
46
Location of Gain (Loss) Recognized in
Income on Derivative Instruments
Amount of Gain (Loss) in Income
on Derivative Instruments
Currency Forward Contracts
Sellin
g
, marketin
g
and administration
$(74)
Currenc
y
O
p
tion Contracts
Sellin
g
, marketin
g
and administration
$4
Location of Gain (Loss) Recognized in
Income on Derivative Instruments
Amount of Gain (Loss) in Income
on Derivative Instruments
Currency Forward Contracts
Sellin
g
, marketin
g
and administration
$(40)
Currenc
y
O
p
tion Contracts
Sellin
g
, marketin
g
and administration
$1