Blackberry 2012 Annual Report Download - page 204
Download and view the complete annual report
Please find page 204 of the 2012 Blackberry annual report below. You can navigate through the pages in the report by either clicking on the pages listed below, or by using the keyword search tool below to find specific information within the annual report.-
 1
1 -
2
-
3
-
4
-
5
-
6
-
7
-
8
-
9
-
10
-
11
-
12
-
13
-
14
-
15
-
16
-
17
-
18
-
19
-
20
-
21
-
22
-
23
-
24
-
25
-
26
-
27
-
28
-
29
-
30
-
31
-
32
-
33
-
34
-
35
-
36
-
37
-
38
-
39
-
40
-
41
-
42
-
43
-
44
-
45
-
46
-
47
-
48
-
49
-
50
-
51
-
52
-
53
-
54
-
55
-
56
-
57
-
58
-
59
-
60
-
61
-
62
-
63
-
64
-
65
-
66
-
67
-
68
-
69
-
70
-
71
-
72
-
73
-
74
-
75
-
76
-
77
-
78
-
79
-
80
-
81
-
82
-
83
-
84
-
85
-
86
-
87
-
88
-
89
-
90
-
91
-
92
-
93
-
94
-
95
-
96
-
97
-
98
-
99
-
100
-
101
-
102
-
103
-
104
-
105
-
106
-
107
-
108
-
109
-
110
-
111
-
112
-
113
-
114
-
115
-
116
-
117
-
118
-
119
-
120
-
121
-
122
-
123
-
124
-
125
-
126
-
127
-
128
-
129
-
130
-
131
-
132
-
133
-
134
-
135
-
136
-
137
-
138
-
139
-
140
-
141
-
142
-
143
-
144
-
145
-
146
-
147
-
148
-
149
-
150
-
151
-
152
-
153
-
154
-
155
-
156
-
157
-
158
-
159
-
160
-
161
-
162
-
163
-
164
-
165
-
166
-
167
-
168
-
169
-
170
-
171
-
172
-
173
-
174
-
175
-
176
-
177
-
178
-
179
-
180
-
181
-
182
-
183
-
184
-
185
-
186
-
187
-
188
-
189
-
190
-
191
-
192
-
193
-
 194
194 -
 195
195 -
 196
196 -
 197
197 -
 198
198 -
 199
199 -
 200
200 -
 201
201 -
 202
202 -
 203
203 -
 204
204 -
 205
205 -
 206
206 -
 207
207 -
 208
208 -
 209
209 -
 210
210 -
 211
211 -
 212
212 -
 213
213 -
 214
214 -
215
-
216
-
217
-
218
-
219
-
220
-
221
-
222
-
223
-
224
-
225
-
226
-
227
-
228
-
229
-
230
-
231
-
232
-
233
-
234
-
235
-
236
-
237
-
238
-
239
-
240
-
241
-
242
-
243
-
244
-
245
-
246
-
247
-
248
-
249
-
250
-
251
-
252
-
253
-
254
-
255
-
256
-
257
-
258
-
259
-
260
-
261
-
262
-
263
-
264
-
265
-
266
-
267
-
268
-
269
-
270
-
271
-
272
-
273
-
274
 |
 |

Research In Motion Limited
Management’s Discussion and Analysis of Financial Condition and Results of Operations
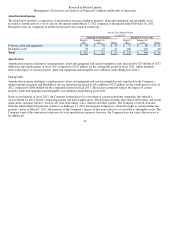
Income Taxes
For fiscal 2011, the Company’s income tax expense was $1.2 billion, resulting in an effective tax rate of 26.6% compared to income
tax expense of $809 million and an effective tax rate of 24.8% for fiscal 2010. The Company’s effective tax rate reflects the
geographic mix of earnings in jurisdictions with different tax rates.
On March 12, 2009, the Government of Canada enacted changes to the Income Tax Act (Canada) that allowed the Company to
calculate its fiscal 2009 and subsequent fiscal year Canadian income tax expense based on the U.S. dollar (the Company’s functional
currency). As such, the Company recorded tax benefits of $145 million related to the enactment of the functional currency rules in the
first quarter of fiscal 2010, resulting in the lower effective rate in fiscal 2010.
The Company has not provided for Canadian income taxes or foreign withholding taxes that would apply on the distribution of
income of its non-Canadian subsidiaries, as this income is intended to be reinvested indefinitely by these subsidiaries.
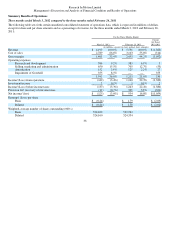
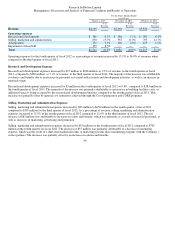
Net Income
Net income was $3.4 billion in fiscal 2011 compared to net income of $2.5 billion in fiscal 2010. The $954 million increase in net
income in fiscal 2011 primarily reflects an increase in gross margin in the amount of $2.2 billion, as well as an increase in
consolidated gross margin percentage, resulting primarily from the increased number of device shipments as well as an increase in
service revenue as a result of additional subscriber accounts, which was partially offset by an increase of $843 million in the
Company’s operating expenses, and an increase of $424 million in the provision for income taxes. Included in net income in fiscal
2010 was the impact of unusual charges of $96 million, a $175 million income tax benefit, which related to the foreign exchange
impact of the enactment of functional currency tax legislation in Canada, and a $164 million litigation charge, which related to the
settlement of the Visto Litigation.
Basic EPS was $6.36 and diluted EPS was $6.34 in fiscal 2011, an increase of 46.2% and 47.1%, respectively, compared to $4.35
basic EPS and $4.31 diluted EPS in fiscal 2010. Diluted EPS of $4.31 for fiscal 2010 included approximately $0.06 from the impact
of unusual charges of $96 million, an income tax benefit of $175 million recognized during the first quarter of fiscal 2010 and a
litigation charge of $164 million recognized during the second quarter of fiscal 2010.
The weighted average number of common shares outstanding was 536 million common shares for basic EPS and 538 million
common shares for diluted EPS for the fiscal year ended February 26, 2011 compared to 565 million common shares for basic EPS
and 570 million common shares for diluted EPS for the fiscal year ended February 27, 2010.
Common Shares Outstanding
On March 22, 2011, there were 524 million common shares, options to purchase 5 million common shares, 3 million restricted share
units and 51,500 deferred share units outstanding.
The Company has not paid any cash dividends during the last three fiscal years.
34