Blackberry 2012 Annual Report Download - page 220
Download and view the complete annual report
Please find page 220 of the 2012 Blackberry annual report below. You can navigate through the pages in the report by either clicking on the pages listed below, or by using the keyword search tool below to find specific information within the annual report.-
 1
1 -
2
-
3
-
4
-
5
-
6
-
7
-
8
-
9
-
10
-
11
-
12
-
13
-
14
-
15
-
16
-
17
-
18
-
19
-
20
-
21
-
22
-
23
-
24
-
25
-
26
-
27
-
28
-
29
-
30
-
31
-
32
-
33
-
34
-
35
-
36
-
37
-
38
-
39
-
40
-
41
-
42
-
43
-
44
-
45
-
46
-
47
-
48
-
49
-
50
-
51
-
52
-
53
-
54
-
55
-
56
-
57
-
58
-
59
-
60
-
61
-
62
-
63
-
64
-
65
-
66
-
67
-
68
-
69
-
70
-
71
-
72
-
73
-
74
-
75
-
76
-
77
-
78
-
79
-
80
-
81
-
82
-
83
-
84
-
85
-
86
-
87
-
88
-
89
-
90
-
91
-
92
-
93
-
94
-
95
-
96
-
97
-
98
-
99
-
100
-
101
-
102
-
103
-
104
-
105
-
106
-
107
-
108
-
109
-
110
-
111
-
112
-
113
-
114
-
115
-
116
-
117
-
118
-
119
-
120
-
121
-
122
-
123
-
124
-
125
-
126
-
127
-
128
-
129
-
130
-
131
-
132
-
133
-
134
-
135
-
136
-
137
-
138
-
139
-
140
-
141
-
142
-
143
-
144
-
145
-
146
-
147
-
148
-
149
-
150
-
151
-
152
-
153
-
154
-
155
-
156
-
157
-
158
-
159
-
160
-
161
-
162
-
163
-
164
-
165
-
166
-
167
-
168
-
169
-
170
-
171
-
172
-
173
-
174
-
175
-
176
-
177
-
178
-
179
-
180
-
181
-
182
-
183
-
184
-
185
-
186
-
187
-
188
-
189
-
190
-
191
-
192
-
193
-
194
-
195
-
196
-
197
-
198
-
199
-
200
-
201
-
202
-
203
-
204
-
205
-
206
-
207
-
208
-
209
-
 210
210 -
 211
211 -
 212
212 -
 213
213 -
 214
214 -
 215
215 -
 216
216 -
 217
217 -
 218
218 -
 219
219 -
 220
220 -
 221
221 -
 222
222 -
 223
223 -
 224
224 -
 225
225 -
 226
226 -
 227
227 -
 228
228 -
 229
229 -
 230
230 -
231
-
232
-
233
-
234
-
235
-
236
-
237
-
238
-
239
-
240
-
241
-
242
-
243
-
244
-
245
-
246
-
247
-
248
-
249
-
250
-
251
-
252
-
253
-
254
-
255
-
256
-
257
-
258
-
259
-
260
-
261
-
262
-
263
-
264
-
265
-
266
-
267
-
268
-
269
-
270
-
271
-
272
-
273
-
274
 |
 |

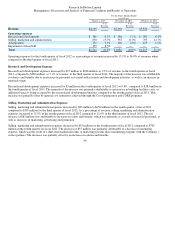
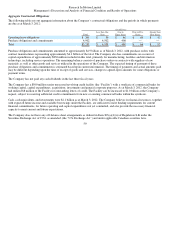
Research In Motion Limited
Management’s Discussion and Analysis of Financial Condition and Results of Operations
A
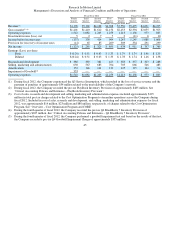
ggregate Contractual Obligations
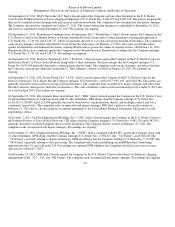
The following table sets out aggregate information about the Company’s contractual obligations and the periods in which payments
are due as at March 3, 2012:
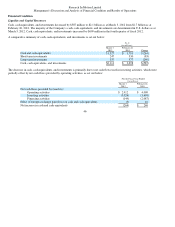
Purchase obligations and commitments amounted to approximately $4.9 billion as of March 3, 2012, with purchase orders with
contract manufacturers representing approximately $4.1 billion of the total. The Company also has commitments on account of
capital expenditures of approximately $836 million included in this total, primarily for manufacturing, facilities and information
technology, including service operations. The remaining balance consists of purchase orders or contracts with suppliers of raw
materials, as well as other goods and services utilized in the operations of the Company. The expected timing of payment of these
purchase obligations and commitments is estimated based upon current information. The timing of payments and actual amounts paid
may be different depending upon the time of receipt of goods and services, changes to agreed-upon amounts for some obligations or
payment terms.
The Company has not paid any cash dividends in the last three fiscal years.
The Company has a $500 million senior unsecured revolving credit facility (the “Facility”) with a syndicate of commercial banks for
working capital, capital expenditures, acquisitions, investments and general corporate purposes. As at March 3, 2012, the Company
had utilized $8 million of the Facility for outstanding letters of credit. The Facility can be increased to $1.0 billion at the Company’s
request, subject to receiving additional credit commitments from new or existing commercial banks within the syndicate.
Cash, cash equivalents, and investments were $2.1 billion as at March 3, 2012. The Company believes its financial resources, together
with expected future income and available borrowings under the Facility, are sufficient to meet funding requirements for current
financial commitments, for future operating and capital expenditures not yet committed, and also provide the necessary financial
capacity to meet current and future expectations.
The Company does not have any off-balance sheet arrangements as defined in Item 303(a)(4)(ii) of Regulation S-K under the
Securities Exchange Act of 1934, as amended, (the “U.S. Exchange Act”) and under applicable Canadian securities laws.
50
(in millions)
Total
Less than One
Year
One to
Three Years
Four to Five
Years
Greater than
Five Years
Operating lease obligations
$301
$56
$86
$66
$93
Purchase obli
g
ations and commitments
4,902
4,502
40
0
—
—
Total
$5,203
$4,558
$486
$66
$93