Blackberry 2012 Annual Report Download - page 215
Download and view the complete annual report
Please find page 215 of the 2012 Blackberry annual report below. You can navigate through the pages in the report by either clicking on the pages listed below, or by using the keyword search tool below to find specific information within the annual report.-
 1
1 -
2
-
3
-
4
-
5
-
6
-
7
-
8
-
9
-
10
-
11
-
12
-
13
-
14
-
15
-
16
-
17
-
18
-
19
-
20
-
21
-
22
-
23
-
24
-
25
-
26
-
27
-
28
-
29
-
30
-
31
-
32
-
33
-
34
-
35
-
36
-
37
-
38
-
39
-
40
-
41
-
42
-
43
-
44
-
45
-
46
-
47
-
48
-
49
-
50
-
51
-
52
-
53
-
54
-
55
-
56
-
57
-
58
-
59
-
60
-
61
-
62
-
63
-
64
-
65
-
66
-
67
-
68
-
69
-
70
-
71
-
72
-
73
-
74
-
75
-
76
-
77
-
78
-
79
-
80
-
81
-
82
-
83
-
84
-
85
-
86
-
87
-
88
-
89
-
90
-
91
-
92
-
93
-
94
-
95
-
96
-
97
-
98
-
99
-
100
-
101
-
102
-
103
-
104
-
105
-
106
-
107
-
108
-
109
-
110
-
111
-
112
-
113
-
114
-
115
-
116
-
117
-
118
-
119
-
120
-
121
-
122
-
123
-
124
-
125
-
126
-
127
-
128
-
129
-
130
-
131
-
132
-
133
-
134
-
135
-
136
-
137
-
138
-
139
-
140
-
141
-
142
-
143
-
144
-
145
-
146
-
147
-
148
-
149
-
150
-
151
-
152
-
153
-
154
-
155
-
156
-
157
-
158
-
159
-
160
-
161
-
162
-
163
-
164
-
165
-
166
-
167
-
168
-
169
-
170
-
171
-
172
-
173
-
174
-
175
-
176
-
177
-
178
-
179
-
180
-
181
-
182
-
183
-
184
-
185
-
186
-
187
-
188
-
189
-
190
-
191
-
192
-
193
-
194
-
195
-
196
-
197
-
198
-
199
-
200
-
201
-
202
-
203
-
204
-
 205
205 -
 206
206 -
 207
207 -
 208
208 -
 209
209 -
 210
210 -
 211
211 -
 212
212 -
 213
213 -
 214
214 -
 215
215 -
 216
216 -
 217
217 -
 218
218 -
 219
219 -
 220
220 -
 221
221 -
 222
222 -
 223
223 -
 224
224 -
 225
225 -
226
-
227
-
228
-
229
-
230
-
231
-
232
-
233
-
234
-
235
-
236
-
237
-
238
-
239
-
240
-
241
-
242
-
243
-
244
-
245
-
246
-
247
-
248
-
249
-
250
-
251
-
252
-
253
-
254
-
255
-
256
-
257
-
258
-
259
-
260
-
261
-
262
-
263
-
264
-
265
-
266
-
267
-
268
-
269
-
270
-
271
-
272
-
273
-
274
 |
 |

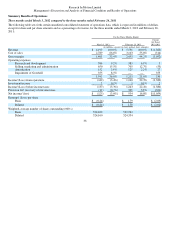
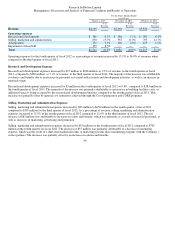
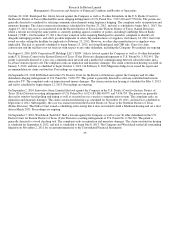
Research In Motion Limited
Management’s Discussion and Analysis of Financial Condition and Results of Operations
45
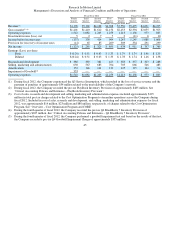
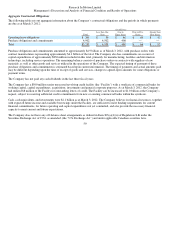
Fiscal Year 2012 Fiscal Year 2011
Fourth
Quarter
Third
Quarter
Second
Quarter
First
Quarter
Fourth
Quarter
Third
Quarter
Second
Quarter
First
Quarter
(in millions, except per share data)
Revenue
$4,190 $5,169
$4,168
$4,908
$5,556
$5,495
$4,621
$4,235
Gross mar
g
in
$1,401
$1,410
$1,612
$2,156
$2,453
$2,394
$2,055
$1,923
O
p
eratin
g
ex
p
enses
1,543
1,082
1,205
1,259
1,213
1,138
973
865
Investment income (loss), net
5 2
7
7
3
(11)
6
10
Income before income taxes
(137)
330
414
904
1,243
1,245
1,088
1,068
Provision for (recover
y
of) income taxes
(12)
65
85
209
309
334
291
299
Net income
$(125)
$265
$329
$695
$934
$911
$797
$769
Earnin
g
s (Loss)
p
er share
Basic
$(0.24)
$0.51
$0.63
$1.33
$1.79
$1.74
$1.46
$1.39
Diluted
$ (0.24)
$0.51
$0.63
$1.33
$ 1.78
$ 1.74
$1.46
$1.38
Research and develo
p
ment
$386 369
381
423
$383
$357
$323
$288
Sellin
g
, marketin
g
and administration
65
0
567
683
704
705
666
546
483
Amortization
152
146
141
132
125
115
104
94
Im
p
airment of Goodwill
355
—
—
—
—
—
—
—
O
p
eratin
g
ex
p
enses
$1,543 $1,082
$1,205
$1,259
$1,213
$1,138
$973
$865
(1) During fiscal 2012, the Company experienced the Q3 Service Interruption, which resulted in the loss of service revenue and the
p
a
y
ment of
p
enalties of a
pp
roximatel
y
$54 million related to the unavailabilit
y
of the Com
p
an
y
’s network.
(2) During fiscal 2012, the Company recorded the pre-tax PlayBook Inventory Provision of approximately $485 million. See
“Critical Accountin
g
Policies and Estimates
–
Pla
y
Book Inventor
y
Provision”.
(3) Cost of sales, research and development and selling, marketing and administration expenses included approximately $125
million in total pre-tax charges related to the Cost Optimization Program to streamline operations across the Company during
fiscal 2012. Included in cost of sales, research and development, and selling, marketing and administration expenses for fiscal
2012, was approximately $14 million, $23 million and $88 million, respectively, of charges related to the Cost Optimization
Pro
g
ram. See “Overview
–
Cost O
p
timization Pro
g
ram and COR
E
”.
(4) During the fourth quarter of fiscal 2012, the Company recorded the pre-tax Q4 BlackBerry 7 Inventory Provision of
a
pp
roximatel
y
$267 million. See “Critical Accountin
g
Policies and Estimates
–
Q4 BlackBerr
y
7 Inventor
y
Provision”.
(5) During the fourth quarter of fiscal 2012, the Company performed a goodwill impairment test and based on the results of that test,
the Com
p
an
y
recorded a
p
re-tax Q4 Goodwill Im
p
airment Char
g
e of a
pp
roximatel
y
$355 million.
(1)
(2,3,4)
(5)