Blackberry 2012 Annual Report Download - page 200
Download and view the complete annual report
Please find page 200 of the 2012 Blackberry annual report below. You can navigate through the pages in the report by either clicking on the pages listed below, or by using the keyword search tool below to find specific information within the annual report.-
 1
1 -
2
-
3
-
4
-
5
-
6
-
7
-
8
-
9
-
10
-
11
-
12
-
13
-
14
-
15
-
16
-
17
-
18
-
19
-
20
-
21
-
22
-
23
-
24
-
25
-
26
-
27
-
28
-
29
-
30
-
31
-
32
-
33
-
34
-
35
-
36
-
37
-
38
-
39
-
40
-
41
-
42
-
43
-
44
-
45
-
46
-
47
-
48
-
49
-
50
-
51
-
52
-
53
-
54
-
55
-
56
-
57
-
58
-
59
-
60
-
61
-
62
-
63
-
64
-
65
-
66
-
67
-
68
-
69
-
70
-
71
-
72
-
73
-
74
-
75
-
76
-
77
-
78
-
79
-
80
-
81
-
82
-
83
-
84
-
85
-
86
-
87
-
88
-
89
-
90
-
91
-
92
-
93
-
94
-
95
-
96
-
97
-
98
-
99
-
100
-
101
-
102
-
103
-
104
-
105
-
106
-
107
-
108
-
109
-
110
-
111
-
112
-
113
-
114
-
115
-
116
-
117
-
118
-
119
-
120
-
121
-
122
-
123
-
124
-
125
-
126
-
127
-
128
-
129
-
130
-
131
-
132
-
133
-
134
-
135
-
136
-
137
-
138
-
139
-
140
-
141
-
142
-
143
-
144
-
145
-
146
-
147
-
148
-
149
-
150
-
151
-
152
-
153
-
154
-
155
-
156
-
157
-
158
-
159
-
160
-
161
-
162
-
163
-
164
-
165
-
166
-
167
-
168
-
169
-
170
-
171
-
172
-
173
-
174
-
175
-
176
-
177
-
178
-
179
-
180
-
181
-
182
-
183
-
184
-
185
-
186
-
187
-
188
-
189
-
 190
190 -
 191
191 -
 192
192 -
 193
193 -
 194
194 -
 195
195 -
 196
196 -
 197
197 -
 198
198 -
 199
199 -
 200
200 -
 201
201 -
 202
202 -
 203
203 -
 204
204 -
 205
205 -
 206
206 -
 207
207 -
 208
208 -
 209
209 -
 210
210 -
211
-
212
-
213
-
214
-
215
-
216
-
217
-
218
-
219
-
220
-
221
-
222
-
223
-
224
-
225
-
226
-
227
-
228
-
229
-
230
-
231
-
232
-
233
-
234
-
235
-
236
-
237
-
238
-
239
-
240
-
241
-
242
-
243
-
244
-
245
-
246
-
247
-
248
-
249
-
250
-
251
-
252
-
253
-
254
-
255
-
256
-
257
-
258
-
259
-
260
-
261
-
262
-
263
-
264
-
265
-
266
-
267
-
268
-
269
-
270
-
271
-
272
-
273
-
274
 |
 |

Research In Motion Limited
Management’s Discussion and Analysis of Financial Condition and Results of Operations
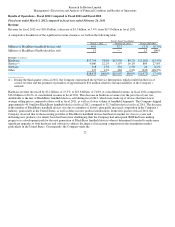
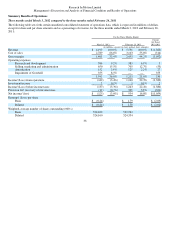
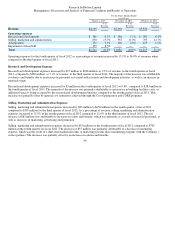
Fiscal year end February 26, 2011 compared to fiscal year ended February 27, 2010
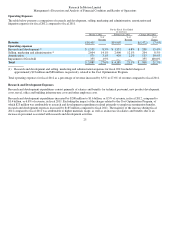
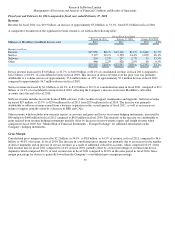
Revenue
Revenue for fiscal 2011 was $19.9 billion, an increase of approximately $5.0 billion, or 33.1%, from $15.0 billion in fiscal 2010.
A comparative breakdown of the significant revenue streams is set forth in the following table:
Device revenue increased by $3.8 billion, or 31.7%, to $16.0 billion, or 80.2% of consolidated revenue, in fiscal 2011 compared to
$12.1 billion, or 81.0%, of consolidated revenue in fiscal 2010. This increase in device revenue over the prior year was primarily
attributable to a volume increase of approximately 15.6 million units, or 43%, to approximately 52.3 million devices in fiscal 2011
compared to approximately 36.7 million devices in fiscal 2010.
Service revenue increased by $1.0 billion, or 48.1%, to $3.2 billion or 16.1% of consolidated revenue in fiscal 2011, compared to $2.2
billion, or 14.4% of consolidated revenue in fiscal 2010, reflecting the Company’s increase in net new BlackBerry subscriber
accounts since the end of fiscal 2010.
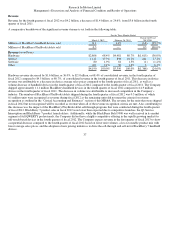
Software revenue includes fees from licensed BES software, CALs, technical support, maintenance and upgrades. Software revenue
increased $35 million, or 13.5%, to $294 million in fiscal 2011 from $259 million in fiscal 2010. The increase was primarily
attributable to software revenue earned from a business acquisition in the second quarter of fiscal 2011, as well as an increase in
technical support, partially offset by a decrease in BES and CALs.
Other revenue, which includes non-warranty repairs, accessories and gains and losses on revenue hedging instruments, increased by
$40 million to $460 million in fiscal 2011 compared to $420 million in fiscal 2010. The majority of the increase was attributable to
gains realized from revenue hedging instruments partially offset by decreases in non-warranty repairs and freight revenue when
compared to fiscal 2010. See “Market Risk of Financial Instruments – Foreign Exchange” for additional information on the
Company’s hedging instruments.
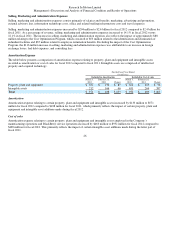
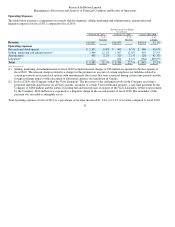
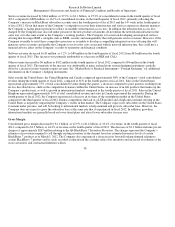
Gross Margin
Consolidated gross margin increased by $2.2 billion, or 34.0%, to $8.8 billion, or 44.3% of revenue, in fiscal 2011, compared to $6.6
billion, or 44.0% of revenue, in fiscal 2010. The increase in consolidated gross margin was primarily due to an increase in the number
of device shipments and an increase in service revenues as a result of additional subscriber accounts, which comprised 16.1% of the
total revenue mix for fiscal 2011 compared to 14.4% in fiscal 2010, partially offset by a lower percentage of revenue from device
shipments which comprised 80.2% of total revenue mix in fiscal 2011 compared to 81.0% in the same period in fiscal 2010. Gross
margin percentage for devices is generally lower than the Company’s consolidated gross margin percentage.
30
For the Fiscal Year Ended
February 26, 2011 February 27, 2010 Change 2011/2010
Millions of BlackBerry handheld devices sold
52.3
36.7
15.6
43%
R
evenue (in millions)
Devices
$15,956
80.2%
$12,116
81.0%
$3,84
0
31.7%
Service
3,197
16.1%
2,158
14.4%
1,039
48.1%
Software
294
1.5% 259
1.7%
35
13.5%
Other
460
2.2% 420
2.9%
40
9.5%
$19,907
100.0%
$14,953
100.0%
$4,954
33.1%