Blackberry 2012 Annual Report Download - page 203
Download and view the complete annual report
Please find page 203 of the 2012 Blackberry annual report below. You can navigate through the pages in the report by either clicking on the pages listed below, or by using the keyword search tool below to find specific information within the annual report.-
 1
1 -
2
-
3
-
4
-
5
-
6
-
7
-
8
-
9
-
10
-
11
-
12
-
13
-
14
-
15
-
16
-
17
-
18
-
19
-
20
-
21
-
22
-
23
-
24
-
25
-
26
-
27
-
28
-
29
-
30
-
31
-
32
-
33
-
34
-
35
-
36
-
37
-
38
-
39
-
40
-
41
-
42
-
43
-
44
-
45
-
46
-
47
-
48
-
49
-
50
-
51
-
52
-
53
-
54
-
55
-
56
-
57
-
58
-
59
-
60
-
61
-
62
-
63
-
64
-
65
-
66
-
67
-
68
-
69
-
70
-
71
-
72
-
73
-
74
-
75
-
76
-
77
-
78
-
79
-
80
-
81
-
82
-
83
-
84
-
85
-
86
-
87
-
88
-
89
-
90
-
91
-
92
-
93
-
94
-
95
-
96
-
97
-
98
-
99
-
100
-
101
-
102
-
103
-
104
-
105
-
106
-
107
-
108
-
109
-
110
-
111
-
112
-
113
-
114
-
115
-
116
-
117
-
118
-
119
-
120
-
121
-
122
-
123
-
124
-
125
-
126
-
127
-
128
-
129
-
130
-
131
-
132
-
133
-
134
-
135
-
136
-
137
-
138
-
139
-
140
-
141
-
142
-
143
-
144
-
145
-
146
-
147
-
148
-
149
-
150
-
151
-
152
-
153
-
154
-
155
-
156
-
157
-
158
-
159
-
160
-
161
-
162
-
163
-
164
-
165
-
166
-
167
-
168
-
169
-
170
-
171
-
172
-
173
-
174
-
175
-
176
-
177
-
178
-
179
-
180
-
181
-
182
-
183
-
184
-
185
-
186
-
187
-
188
-
189
-
190
-
191
-
192
-
 193
193 -
 194
194 -
 195
195 -
 196
196 -
 197
197 -
 198
198 -
 199
199 -
 200
200 -
 201
201 -
 202
202 -
 203
203 -
 204
204 -
 205
205 -
 206
206 -
 207
207 -
 208
208 -
 209
209 -
 210
210 -
 211
211 -
 212
212 -
 213
213 -
214
-
215
-
216
-
217
-
218
-
219
-
220
-
221
-
222
-
223
-
224
-
225
-
226
-
227
-
228
-
229
-
230
-
231
-
232
-
233
-
234
-
235
-
236
-
237
-
238
-
239
-
240
-
241
-
242
-
243
-
244
-
245
-
246
-
247
-
248
-
249
-
250
-
251
-
252
-
253
-
254
-
255
-
256
-
257
-
258
-
259
-
260
-
261
-
262
-
263
-
264
-
265
-
266
-
267
-
268
-
269
-
270
-
271
-
272
-
273
-
274
 |
 |

Research In Motion Limited
Management’s Discussion and Analysis of Financial Condition and Results of Operations
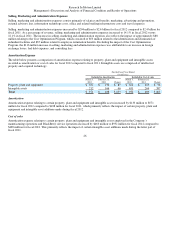
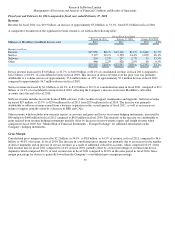
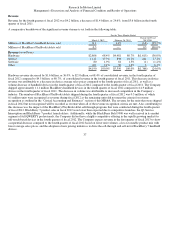
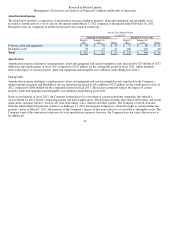
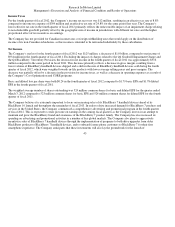
Amortization Expense
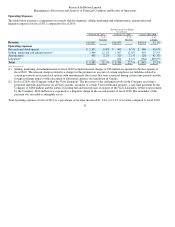
The table below presents a comparison of amortization expense relating to property, plant and equipment and intangible assets
recorded as amortization or cost of sales for fiscal 2011 compared to fiscal 2010. Intangible assets are comprised of intellectual
property and acquired technology.
A
mortization
Amortization expense relating to certain property, plant and equipment and certain intangible assets increased by $128 million to
$438 million for fiscal 2011 compared to $310 million for fiscal 2010, which primarily reflects the impact of certain property, plant
and equipment and intangible asset additions made during fiscal 2011.
Cost of sales
Amortization expense relating to certain property, plant and equipment and certain intangible assets employed in the Company’s
manufacturing operations and BlackBerry service operations increased by $183 million to $489 million for fiscal 2011 compared to
$306 million for fiscal 2010, which primarily reflects the impact of certain property, plant and equipment and intangible asset
additions made during fiscal 2011.
Litigation Expense
In fiscal 2010, the Company settled the Visto Litigation. The key terms of the settlement involved the Company receiving a perpetual
and fully-paid license on all Visto patents, a transfer of certain Visto intellectual property, a one-time payment by the Company of
$268 million and the parties executing full and final releases in respect of the Visto Litigation. Of the total payment by the Company,
$164 million was expensed as a litigation charge in the second quarter of fiscal 2010. The remainder of the payment was recorded as
intangible assets.
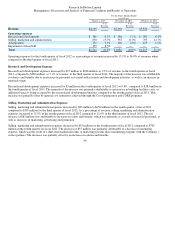
Investment Income
Investment income decreased by $20 million to $8 million in fiscal 2011 from $28 million in fiscal 2010. The decrease primarily
reflects impairment charges recognized in the third quarter of fiscal 2011 of $17 million. The decrease was also partially attributed to
slight decreases in yields due to lower interest rates when compared to fiscal 2010.
33
For the Fiscal Year Ended
(in millions)
Included in Amortization Included in Cost of sales
February 26,
2011
February 27,
2010 Chan
g
e
February 26,
2011
February 27,
2010 Chan
g
e
Property, plant and equipment
$272
$185
$87
$225
$160
$65
Intan
g
ible assets
166
125
41
264
146
118
Total
$438
$310
$128
$489
$306
$183