Blackberry 2012 Annual Report Download - page 216
Download and view the complete annual report
Please find page 216 of the 2012 Blackberry annual report below. You can navigate through the pages in the report by either clicking on the pages listed below, or by using the keyword search tool below to find specific information within the annual report.-
 1
1 -
2
-
3
-
4
-
5
-
6
-
7
-
8
-
9
-
10
-
11
-
12
-
13
-
14
-
15
-
16
-
17
-
18
-
19
-
20
-
21
-
22
-
23
-
24
-
25
-
26
-
27
-
28
-
29
-
30
-
31
-
32
-
33
-
34
-
35
-
36
-
37
-
38
-
39
-
40
-
41
-
42
-
43
-
44
-
45
-
46
-
47
-
48
-
49
-
50
-
51
-
52
-
53
-
54
-
55
-
56
-
57
-
58
-
59
-
60
-
61
-
62
-
63
-
64
-
65
-
66
-
67
-
68
-
69
-
70
-
71
-
72
-
73
-
74
-
75
-
76
-
77
-
78
-
79
-
80
-
81
-
82
-
83
-
84
-
85
-
86
-
87
-
88
-
89
-
90
-
91
-
92
-
93
-
94
-
95
-
96
-
97
-
98
-
99
-
100
-
101
-
102
-
103
-
104
-
105
-
106
-
107
-
108
-
109
-
110
-
111
-
112
-
113
-
114
-
115
-
116
-
117
-
118
-
119
-
120
-
121
-
122
-
123
-
124
-
125
-
126
-
127
-
128
-
129
-
130
-
131
-
132
-
133
-
134
-
135
-
136
-
137
-
138
-
139
-
140
-
141
-
142
-
143
-
144
-
145
-
146
-
147
-
148
-
149
-
150
-
151
-
152
-
153
-
154
-
155
-
156
-
157
-
158
-
159
-
160
-
161
-
162
-
163
-
164
-
165
-
166
-
167
-
168
-
169
-
170
-
171
-
172
-
173
-
174
-
175
-
176
-
177
-
178
-
179
-
180
-
181
-
182
-
183
-
184
-
185
-
186
-
187
-
188
-
189
-
190
-
191
-
192
-
193
-
194
-
195
-
196
-
197
-
198
-
199
-
200
-
201
-
202
-
203
-
204
-
205
-
 206
206 -
 207
207 -
 208
208 -
 209
209 -
 210
210 -
 211
211 -
 212
212 -
 213
213 -
 214
214 -
 215
215 -
 216
216 -
 217
217 -
 218
218 -
 219
219 -
 220
220 -
 221
221 -
 222
222 -
 223
223 -
 224
224 -
 225
225 -
 226
226 -
227
-
228
-
229
-
230
-
231
-
232
-
233
-
234
-
235
-
236
-
237
-
238
-
239
-
240
-
241
-
242
-
243
-
244
-
245
-
246
-
247
-
248
-
249
-
250
-
251
-
252
-
253
-
254
-
255
-
256
-
257
-
258
-
259
-
260
-
261
-
262
-
263
-
264
-
265
-
266
-
267
-
268
-
269
-
270
-
271
-
272
-
273
-
274
 |
 |

Research In Motion Limited
Management’s Discussion and Analysis of Financial Condition and Results of Operations
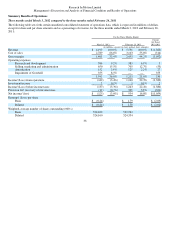
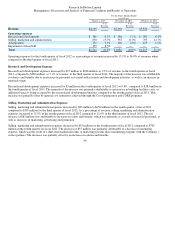
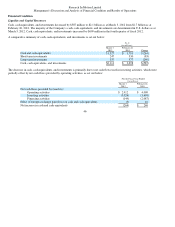
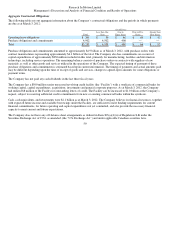
Financial Condition
L
iquidity and Capital Resources
Cash, cash equivalents, and investments decreased by $587 million to $2.1 billion as at March 3, 2012 from $2.7 billion as at
February 26, 2011. The majority of the Company’s cash, cash equivalents, and investments are denominated in U.S. dollars as at
March 3, 2012. Cash, cash equivalents, and investments increased by $609 million in the fourth quarter of fiscal 2012.
A comparative summary of cash, cash equivalents, and investments is set out below:
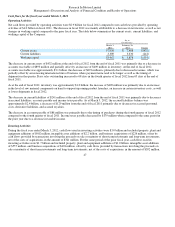
The decrease in cash, cash equivalents, and investments is primarily due to net cash flows used in investing activities, which were
partially offset by net cash flows provided by operating activities, as set out below:
46
As at
(in millions)
March 3,
2012
February 26,
2011 Change
Cash and cash equivalents
$1,527
$1,791
$(264)
Short-term investments
247
330
(83)
Lon
g
-term investments
337
577
(24
0
)
Cash, cash e
q
uivalents, and investments
$2,111
$ 2,698
$(587)
For the Fiscal Year Ended
(in millions)
March 3,
2012
February 26,
2011
Net cash flows
p
rovided b
y
(used in):
O
p
eratin
g
activities
$ 2,912
$ 4,009
Investin
g
activities
(3,024)
(1,698)
Financin
g
activities
(149)
(2,087)
Effect of forei
g
n exchan
g
e
g
ain (loss) on cash and cash e
q
uivalents
(3)
16
Net increase in cash and cash e
q
uivalents
(264)
$24
0