Blackberry 2012 Annual Report Download - page 198
Download and view the complete annual report
Please find page 198 of the 2012 Blackberry annual report below. You can navigate through the pages in the report by either clicking on the pages listed below, or by using the keyword search tool below to find specific information within the annual report.-
 1
1 -
2
-
3
-
4
-
5
-
6
-
7
-
8
-
9
-
10
-
11
-
12
-
13
-
14
-
15
-
16
-
17
-
18
-
19
-
20
-
21
-
22
-
23
-
24
-
25
-
26
-
27
-
28
-
29
-
30
-
31
-
32
-
33
-
34
-
35
-
36
-
37
-
38
-
39
-
40
-
41
-
42
-
43
-
44
-
45
-
46
-
47
-
48
-
49
-
50
-
51
-
52
-
53
-
54
-
55
-
56
-
57
-
58
-
59
-
60
-
61
-
62
-
63
-
64
-
65
-
66
-
67
-
68
-
69
-
70
-
71
-
72
-
73
-
74
-
75
-
76
-
77
-
78
-
79
-
80
-
81
-
82
-
83
-
84
-
85
-
86
-
87
-
88
-
89
-
90
-
91
-
92
-
93
-
94
-
95
-
96
-
97
-
98
-
99
-
100
-
101
-
102
-
103
-
104
-
105
-
106
-
107
-
108
-
109
-
110
-
111
-
112
-
113
-
114
-
115
-
116
-
117
-
118
-
119
-
120
-
121
-
122
-
123
-
124
-
125
-
126
-
127
-
128
-
129
-
130
-
131
-
132
-
133
-
134
-
135
-
136
-
137
-
138
-
139
-
140
-
141
-
142
-
143
-
144
-
145
-
146
-
147
-
148
-
149
-
150
-
151
-
152
-
153
-
154
-
155
-
156
-
157
-
158
-
159
-
160
-
161
-
162
-
163
-
164
-
165
-
166
-
167
-
168
-
169
-
170
-
171
-
172
-
173
-
174
-
175
-
176
-
177
-
178
-
179
-
180
-
181
-
182
-
183
-
184
-
185
-
186
-
187
-
 188
188 -
 189
189 -
 190
190 -
 191
191 -
 192
192 -
 193
193 -
 194
194 -
 195
195 -
 196
196 -
 197
197 -
 198
198 -
 199
199 -
 200
200 -
 201
201 -
 202
202 -
 203
203 -
 204
204 -
 205
205 -
 206
206 -
 207
207 -
 208
208 -
209
-
210
-
211
-
212
-
213
-
214
-
215
-
216
-
217
-
218
-
219
-
220
-
221
-
222
-
223
-
224
-
225
-
226
-
227
-
228
-
229
-
230
-
231
-
232
-
233
-
234
-
235
-
236
-
237
-
238
-
239
-
240
-
241
-
242
-
243
-
244
-
245
-
246
-
247
-
248
-
249
-
250
-
251
-
252
-
253
-
254
-
255
-
256
-
257
-
258
-
259
-
260
-
261
-
262
-
263
-
264
-
265
-
266
-
267
-
268
-
269
-
270
-
271
-
272
-
273
-
274
 |
 |

Research In Motion Limited
Management’s Discussion and Analysis of Financial Condition and Results of Operations
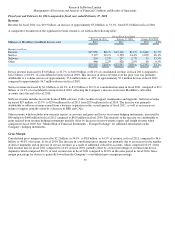
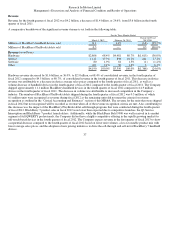
Investment Income
Investment income increased by $13 million to $21 million in fiscal 2012 from $8 million in fiscal 2011. Investment income in fiscal
2011 includes $17 million in impairment losses on the Company’s auction rate securities and Lehman Brothers trust assets, without
which investment income would have been $25 million. Excluding the impairment losses, the decrease primarily reflects the decrease
in the Company’s average cash, cash equivalents and investment balances compared to fiscal 2011, as well as a decrease in the
average yield due compared to fiscal 2011. See “Financial Condition - Liquidity and Capital Resources”, “Financial Condition –
Lehman Brothers International (Europe)” and “Financial Condition – Auction Rate Securities”.
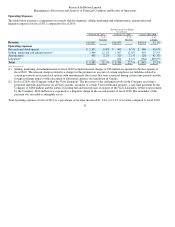
Income Taxes
For fiscal 2012, the Company’s income tax expense was $347 million, resulting in an effective tax rate of 23.0% compared to income
tax expense of $1.2 billion and an effective tax rate of 26.6% for the same period last year. The Company’s lower effective tax rate in
fiscal 2012 reflects the geographic mix of earnings in jurisdictions with different tax rates, the favourable resolution of uncertain tax
positions, and the higher proportional effect of tax incentives on earnings offset by the unfavourable impact of an impairment charge
relating to non-deductible goodwill.
The Company has not provided for Canadian income taxes or foreign withholding taxes that would apply on the distribution of
income of its non-Canadian subsidiaries, as this income is intended to be reinvested indefinitely by these subsidiaries.
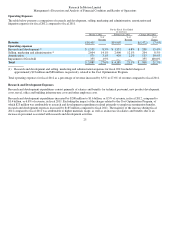
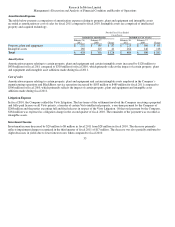
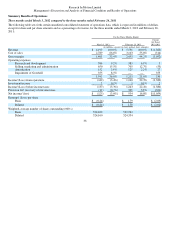
Net Income
Net income decreased by $2.2 billion to $1.2 billion in fiscal 2012 compared to net income of $3.4 billion in the prior fiscal year.
Excluding the impact of charges related to the Q4 Goodwill Impairment Charge, the Q4 BlackBerry 7 Inventory Provision, the Cost
Optimization Program, the PlayBook Inventory Provision and the charges related to the Q3 Service Interruption, net income
decreased by $1.2 billion compared to fiscal 2011. The $1.2 billion decrease in net income primarily reflects a decrease in the
Company’s gross margin, which was negatively impacted by the decreased number of BlackBerry handheld device shipments in
fiscal 2012 compared to fiscal 2011, as well as a change in the mix of BlackBerry handheld devices sold, which were weighted
towards products with lower average selling prices and gross margins. In addition, an increase in operating expenses in the amount of
$545 million also contributed to the decrease in net income compared to fiscal 2011. The impact of the BlackBerry PlayBook sell-
through programs conducted during the third and fourth quarters of fiscal 2012 further contributed to the year-over-year decline in the
consolidated gross margin. This decrease was partially offset by an increase in service revenue as a result of additional subscriber
accounts, as well as a decrease of $886 million in the provision for income taxes.
Basic and diluted EPS was $2.22 in fiscal 2012, a decrease of 65.1% and 65.0%, respectively, compared to $6.36 basic EPS and $6.34
diluted EPS in fiscal 2011.
The weighted average number of common shares outstanding was 524 million common shares for both basic and diluted EPS for the
fiscal year ended March 3, 2012 compared to 536 million common shares for basic EPS and 538 million common shares for diluted
EPS for the fiscal year ended February 26, 2011.
28