Blackberry 2012 Annual Report Download - page 159
Download and view the complete annual report
Please find page 159 of the 2012 Blackberry annual report below. You can navigate through the pages in the report by either clicking on the pages listed below, or by using the keyword search tool below to find specific information within the annual report.-
 1
1 -
2
-
3
-
4
-
5
-
6
-
7
-
8
-
9
-
10
-
11
-
12
-
13
-
14
-
15
-
16
-
17
-
18
-
19
-
20
-
21
-
22
-
23
-
24
-
25
-
26
-
27
-
28
-
29
-
30
-
31
-
32
-
33
-
34
-
35
-
36
-
37
-
38
-
39
-
40
-
41
-
42
-
43
-
44
-
45
-
46
-
47
-
48
-
49
-
50
-
51
-
52
-
53
-
54
-
55
-
56
-
57
-
58
-
59
-
60
-
61
-
62
-
63
-
64
-
65
-
66
-
67
-
68
-
69
-
70
-
71
-
72
-
73
-
74
-
75
-
76
-
77
-
78
-
79
-
80
-
81
-
82
-
83
-
84
-
85
-
86
-
87
-
88
-
89
-
90
-
91
-
92
-
93
-
94
-
95
-
96
-
97
-
98
-
99
-
100
-
101
-
102
-
103
-
104
-
105
-
106
-
107
-
108
-
109
-
110
-
111
-
112
-
113
-
114
-
115
-
116
-
117
-
118
-
119
-
120
-
121
-
122
-
123
-
124
-
125
-
126
-
127
-
128
-
129
-
130
-
131
-
132
-
133
-
134
-
135
-
136
-
137
-
138
-
139
-
140
-
141
-
142
-
143
-
144
-
145
-
146
-
147
-
148
-
 149
149 -
 150
150 -
 151
151 -
 152
152 -
 153
153 -
 154
154 -
 155
155 -
 156
156 -
 157
157 -
 158
158 -
 159
159 -
 160
160 -
 161
161 -
 162
162 -
 163
163 -
 164
164 -
 165
165 -
 166
166 -
 167
167 -
 168
168 -
 169
169 -
170
-
171
-
172
-
173
-
174
-
175
-
176
-
177
-
178
-
179
-
180
-
181
-
182
-
183
-
184
-
185
-
186
-
187
-
188
-
189
-
190
-
191
-
192
-
193
-
194
-
195
-
196
-
197
-
198
-
199
-
200
-
201
-
202
-
203
-
204
-
205
-
206
-
207
-
208
-
209
-
210
-
211
-
212
-
213
-
214
-
215
-
216
-
217
-
218
-
219
-
220
-
221
-
222
-
223
-
224
-
225
-
226
-
227
-
228
-
229
-
230
-
231
-
232
-
233
-
234
-
235
-
236
-
237
-
238
-
239
-
240
-
241
-
242
-
243
-
244
-
245
-
246
-
247
-
248
-
249
-
250
-
251
-
252
-
253
-
254
-
255
-
256
-
257
-
258
-
259
-
260
-
261
-
262
-
263
-
264
-
265
-
266
-
267
-
268
-
269
-
270
-
271
-
272
-
273
-
274
 |
 |

Research In Motion Limited
Notes to the Consolidated Financial Statements
In millions of United States dollars, except share and per share data, and except as otherwise indicated
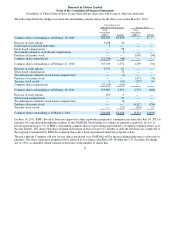
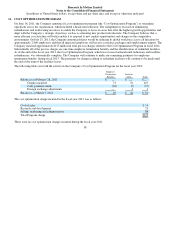
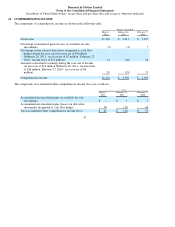
On June 16, 2011, the Company announced a cost optimization program (the “Cost Optimization Program”) to streamline
operations across the organization, which included a headcount reduction. The realignment is focused on eliminating
redundancies and reallocating resources to enable the Company to focus on areas that offer the highest growth opportunities and
align with the Company’s strategic objectives, such as accelerating new product introductions. The Company believes that a
more efficient cost structure will better enable it to respond to new market opportunities and changes in the competitive
environment. On July 25, 2011, the Company announced that it would be reducing its global workforce across all functions by
approximately 2,000 employees and that all impacted employees will receive severance packages and outplacement support. The
Company incurred approximately $125 million in total pre-tax charges related to the Cost Optimization Program in fiscal 2012.
Substantially all of the pre-tax charges are one-time employee termination benefits and the identification of redundant facilities.
As of the end of the fiscal year 2012, the Cost Optimization Program, which was focused on headcount reductions and facilities
redundancies, was substantially complete. The Company will continue to make any remaining payments for employee
termination benefits during fiscal 2013. The payments for charges relating to redundant facilities will continue to be made until
the end of the term of the facilities leases.
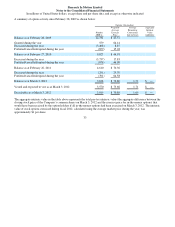
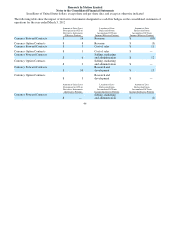
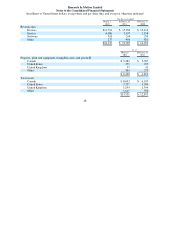
The following table sets forth the activity in the Company’s Cost Optimization Program for the fiscal year 2012:
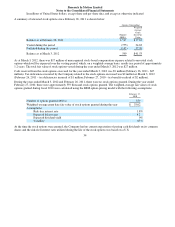
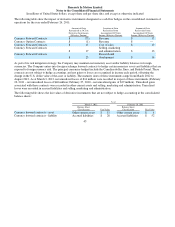
The cost optimization charge incurred in the fiscal year 2012 was as follows:
There were no cost optimization charges incurred during the fiscal year 2011.
38
11. COST OPTIMIZATION PROGRAM
Employee
Termination
Benefits
Facilities
Costs Total
Balance as at February 28, 2011
$
—
$
—
$
—
Char
g
es incurred
73
52
125
Cash
p
a
y
ments made
(63)
(9)
(72)
Forei
g
n exchan
g
e ad
j
ustments
—
1
1
Balance as at March 3, 2012
$10
$44
$54
Cost of sales
$14
Research and develo
p
ment
23
Sellin
g
, marketin
g
and administration
88
Total Pro
g
ram char
g
e
$125