Blackberry 2012 Annual Report Download - page 180
Download and view the complete annual report
Please find page 180 of the 2012 Blackberry annual report below. You can navigate through the pages in the report by either clicking on the pages listed below, or by using the keyword search tool below to find specific information within the annual report.-
 1
1 -
2
-
3
-
4
-
5
-
6
-
7
-
8
-
9
-
10
-
11
-
12
-
13
-
14
-
15
-
16
-
17
-
18
-
19
-
20
-
21
-
22
-
23
-
24
-
25
-
26
-
27
-
28
-
29
-
30
-
31
-
32
-
33
-
34
-
35
-
36
-
37
-
38
-
39
-
40
-
41
-
42
-
43
-
44
-
45
-
46
-
47
-
48
-
49
-
50
-
51
-
52
-
53
-
54
-
55
-
56
-
57
-
58
-
59
-
60
-
61
-
62
-
63
-
64
-
65
-
66
-
67
-
68
-
69
-
70
-
71
-
72
-
73
-
74
-
75
-
76
-
77
-
78
-
79
-
80
-
81
-
82
-
83
-
84
-
85
-
86
-
87
-
88
-
89
-
90
-
91
-
92
-
93
-
94
-
95
-
96
-
97
-
98
-
99
-
100
-
101
-
102
-
103
-
104
-
105
-
106
-
107
-
108
-
109
-
110
-
111
-
112
-
113
-
114
-
115
-
116
-
117
-
118
-
119
-
120
-
121
-
122
-
123
-
124
-
125
-
126
-
127
-
128
-
129
-
130
-
131
-
132
-
133
-
134
-
135
-
136
-
137
-
138
-
139
-
140
-
141
-
142
-
143
-
144
-
145
-
146
-
147
-
148
-
149
-
150
-
151
-
152
-
153
-
154
-
155
-
156
-
157
-
158
-
159
-
160
-
161
-
162
-
163
-
164
-
165
-
166
-
167
-
168
-
169
-
 170
170 -
 171
171 -
 172
172 -
 173
173 -
 174
174 -
 175
175 -
 176
176 -
 177
177 -
 178
178 -
 179
179 -
 180
180 -
 181
181 -
 182
182 -
 183
183 -
 184
184 -
 185
185 -
 186
186 -
 187
187 -
 188
188 -
 189
189 -
 190
190 -
191
-
192
-
193
-
194
-
195
-
196
-
197
-
198
-
199
-
200
-
201
-
202
-
203
-
204
-
205
-
206
-
207
-
208
-
209
-
210
-
211
-
212
-
213
-
214
-
215
-
216
-
217
-
218
-
219
-
220
-
221
-
222
-
223
-
224
-
225
-
226
-
227
-
228
-
229
-
230
-
231
-
232
-
233
-
234
-
235
-
236
-
237
-
238
-
239
-
240
-
241
-
242
-
243
-
244
-
245
-
246
-
247
-
248
-
249
-
250
-
251
-
252
-
253
-
254
-
255
-
256
-
257
-
258
-
259
-
260
-
261
-
262
-
263
-
264
-
265
-
266
-
267
-
268
-
269
-
270
-
271
-
272
-
273
-
274
 |
 |

Research In Motion Limited
Management’s Discussion and Analysis of Financial Condition and Results of Operations
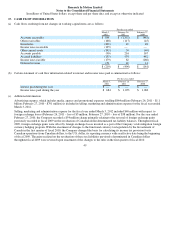
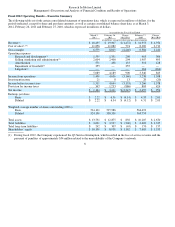
Revenue for fiscal 2012 was $18.4 billion, a decrease of $1.5 billion, or 7.4%, from $19.9 billion in fiscal 2011. The number of
BlackBerry devices sold decreased by approximately 3.3 million, or 6.3%, to approximately 49.0 million in fiscal 2012, compared to
approximately 52.3 million in fiscal 2011. Device revenue decreased by $2.2 billion, or 13.5%, to $13.8 billion, reflecting a lower
number of devices sold, as well as a lower average sale price per unit. Service revenue increased by $0.9 billion, or 27.8% to $4.1
billion, reflecting the increase in net new BlackBerry subscriber accounts since the end of fiscal 2011. Software revenue increased by
$23 million to $317 million in fiscal 2012 and other revenue decreased by $223 million to $237 million in fiscal 2012.
The Company’s net income for fiscal 2012 was $1.2 billion, a decrease of $2.2 billion, or 64.7%, compared to net income of $3.4
billion in fiscal 2011. The $2.2 billion decrease in net income in fiscal 2012 reflects a similar decrease in gross margin. The decrease
in gross margin also reflects the impact of charges related to the Q3 Service Interruption, the PlayBook Inventory Provision, the Cost
Optimization Program and the Q4 BlackBerry 7 Inventory Provision. Excluding the impact of the charges noted above, the decrease
in gross margin resulted primarily from the decreased number of device shipments, as well as the mix of BlackBerry handheld
devices sold during fiscal 2012, which were weighted towards in-life products with lower average selling prices and gross margins.
This was partially offset by an increase of service revenue as a result of additional subscriber accounts.
Basic earnings per share (“basic EPS”) and diluted earnings per share (“diluted EPS”) were $2.22 in fiscal 2012 compared to $6.36
basic EPS and $6.34 diluted EPS in fiscal 2011, a 65.0% decrease in diluted EPS compared to fiscal 2011.
A more comprehensive analysis of these factors is contained in “Results of Operations”.
Critical Accounting Policies and Estimates
General
The preparation of the Consolidated Financial Statements requires management to make estimates and assumptions with respect to
the reported amounts of assets, liabilities, revenues and expenses and the disclosure of contingent assets and liabilities. These
estimates and assumptions are based upon management’s historical experience and are believed by management to be reasonable
under the circumstances. Such estimates and assumptions are evaluated on an ongoing basis and form the basis for making judgments
about the carrying values of assets and liabilities that are not readily apparent from other sources. Actual results could differ
significantly from these estimates.
The Company’s critical accounting policies and estimates have been reviewed and discussed with the Company’s Audit & Risk
Management Committee and are set out below. The Company’s significant accounting policies are described in Note 1 to the
Consolidated Financial Statements. Except as noted below, there have not been any changes to the Company’s critical accounting
policies and estimates during the past three fiscal years.
Revenue Recognition
The Company recognizes revenue when it is realized or realizable and earned. The Company considers revenue realized or realizable
and earned when it has persuasive evidence of an arrangement, the product has been delivered or the services have been provided to
the customer, the sales price is fixed or determinable and collection is reasonably assured. In addition to this general policy, the
following paragraphs describe the specific revenue recognition policies for each of the Company’s major categories of revenue.
10