Blackberry 2012 Annual Report Download - page 206
Download and view the complete annual report
Please find page 206 of the 2012 Blackberry annual report below. You can navigate through the pages in the report by either clicking on the pages listed below, or by using the keyword search tool below to find specific information within the annual report.-
 1
1 -
2
-
3
-
4
-
5
-
6
-
7
-
8
-
9
-
10
-
11
-
12
-
13
-
14
-
15
-
16
-
17
-
18
-
19
-
20
-
21
-
22
-
23
-
24
-
25
-
26
-
27
-
28
-
29
-
30
-
31
-
32
-
33
-
34
-
35
-
36
-
37
-
38
-
39
-
40
-
41
-
42
-
43
-
44
-
45
-
46
-
47
-
48
-
49
-
50
-
51
-
52
-
53
-
54
-
55
-
56
-
57
-
58
-
59
-
60
-
61
-
62
-
63
-
64
-
65
-
66
-
67
-
68
-
69
-
70
-
71
-
72
-
73
-
74
-
75
-
76
-
77
-
78
-
79
-
80
-
81
-
82
-
83
-
84
-
85
-
86
-
87
-
88
-
89
-
90
-
91
-
92
-
93
-
94
-
95
-
96
-
97
-
98
-
99
-
100
-
101
-
102
-
103
-
104
-
105
-
106
-
107
-
108
-
109
-
110
-
111
-
112
-
113
-
114
-
115
-
116
-
117
-
118
-
119
-
120
-
121
-
122
-
123
-
124
-
125
-
126
-
127
-
128
-
129
-
130
-
131
-
132
-
133
-
134
-
135
-
136
-
137
-
138
-
139
-
140
-
141
-
142
-
143
-
144
-
145
-
146
-
147
-
148
-
149
-
150
-
151
-
152
-
153
-
154
-
155
-
156
-
157
-
158
-
159
-
160
-
161
-
162
-
163
-
164
-
165
-
166
-
167
-
168
-
169
-
170
-
171
-
172
-
173
-
174
-
175
-
176
-
177
-
178
-
179
-
180
-
181
-
182
-
183
-
184
-
185
-
186
-
187
-
188
-
189
-
190
-
191
-
192
-
193
-
194
-
195
-
 196
196 -
 197
197 -
 198
198 -
 199
199 -
 200
200 -
 201
201 -
 202
202 -
 203
203 -
 204
204 -
 205
205 -
 206
206 -
 207
207 -
 208
208 -
 209
209 -
 210
210 -
 211
211 -
 212
212 -
 213
213 -
 214
214 -
 215
215 -
 216
216 -
217
-
218
-
219
-
220
-
221
-
222
-
223
-
224
-
225
-
226
-
227
-
228
-
229
-
230
-
231
-
232
-
233
-
234
-
235
-
236
-
237
-
238
-
239
-
240
-
241
-
242
-
243
-
244
-
245
-
246
-
247
-
248
-
249
-
250
-
251
-
252
-
253
-
254
-
255
-
256
-
257
-
258
-
259
-
260
-
261
-
262
-
263
-
264
-
265
-
266
-
267
-
268
-
269
-
270
-
271
-
272
-
273
-
274
 |
 |

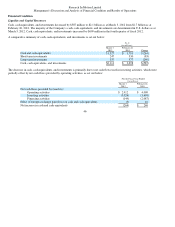
Research In Motion Limited
Management’s Discussion and Analysis of Financial Condition and Results of Operations
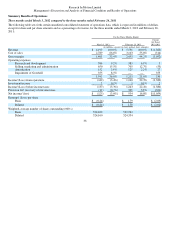
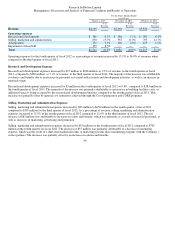
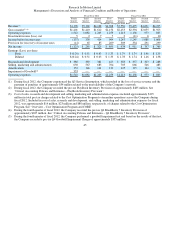
Summary Results of Operations
Three months ended March 3, 2012 compared to the three months ended February 26, 2011
The following table sets forth certain unaudited consolidated statement of operations data, which is expressed in millions of dollars,
except for share and per share amounts and as a percentage of revenue, for the three months ended March 3, 2012 and February 26,
2011:
36
For the Three Months Ended
March 3, 2012 Februar
y
26, 2011
Change
Q4 Fiscal
2012/2011
(in millions, except for share and per share amounts)
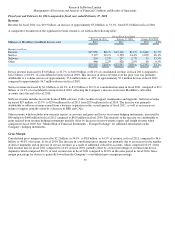
Revenue
$4,19
0
100.0%
$5,556
100.
0
%
$(1,366)
Cost of sales
2,789
66.6%
3,103
55.8%
(314)
Gross mar
g
in
1,401
33.4%
2,453
44.2%
(1,052)
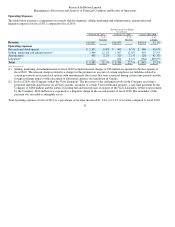
O
p
eratin
g
ex
p
enses
Research and develo
p
ment
386
9.2%
383
6.9%
3
Sellin
g
, marketin
g
and administration
65
0
15.5%
705
12.7%
(55)
Amortization
152
3.6%
125
2.2%
27
Im
p
airment of Goodwill
355
8.5%
—
—
355
1,543
36.8%
1,213
21.8%
330
Income/ (Loss) from o
p
erations
(142) (3.4%) 1,24
0
22.3%
(1,382)
Investment income
5
0.1%
3
0.1%
2
Income/ (Loss) before income taxes
(137)
(3.3%)
1,243
22.4%
(1,380)
Provision for/ (recover
y
of) income taxes
(12) (0.3%) 309
5.6%
(321)
Net income/ (loss)
$ (125)
(3.0%)
$ 934
16.8%
$ (1,059)
Earnin
g
s/ (Loss)
p
er share
Basic
$ (0.24)
$ 1.79
$ (2.03)
Diluted
$(0.24)
$1.78
$(2.02)
Wei
g
hted-avera
g
e number of shares outstandin
g
(00
0
’s)
Basic
524,16
0
522,764
Diluted
524,16
0
524,334