Blackberry 2012 Annual Report Download - page 135
Download and view the complete annual report
Please find page 135 of the 2012 Blackberry annual report below. You can navigate through the pages in the report by either clicking on the pages listed below, or by using the keyword search tool below to find specific information within the annual report.-
 1
1 -
2
-
3
-
4
-
5
-
6
-
7
-
8
-
9
-
10
-
11
-
12
-
13
-
14
-
15
-
16
-
17
-
18
-
19
-
20
-
21
-
22
-
23
-
24
-
25
-
26
-
27
-
28
-
29
-
30
-
31
-
32
-
33
-
34
-
35
-
36
-
37
-
38
-
39
-
40
-
41
-
42
-
43
-
44
-
45
-
46
-
47
-
48
-
49
-
50
-
51
-
52
-
53
-
54
-
55
-
56
-
57
-
58
-
59
-
60
-
61
-
62
-
63
-
64
-
65
-
66
-
67
-
68
-
69
-
70
-
71
-
72
-
73
-
74
-
75
-
76
-
77
-
78
-
79
-
80
-
81
-
82
-
83
-
84
-
85
-
86
-
87
-
88
-
89
-
90
-
91
-
92
-
93
-
94
-
95
-
96
-
97
-
98
-
99
-
100
-
101
-
102
-
103
-
104
-
105
-
106
-
107
-
108
-
109
-
110
-
111
-
112
-
113
-
114
-
115
-
116
-
117
-
118
-
119
-
120
-
121
-
122
-
123
-
124
-
 125
125 -
 126
126 -
 127
127 -
 128
128 -
 129
129 -
 130
130 -
 131
131 -
 132
132 -
 133
133 -
 134
134 -
 135
135 -
 136
136 -
 137
137 -
 138
138 -
 139
139 -
 140
140 -
 141
141 -
 142
142 -
 143
143 -
 144
144 -
 145
145 -
146
-
147
-
148
-
149
-
150
-
151
-
152
-
153
-
154
-
155
-
156
-
157
-
158
-
159
-
160
-
161
-
162
-
163
-
164
-
165
-
166
-
167
-
168
-
169
-
170
-
171
-
172
-
173
-
174
-
175
-
176
-
177
-
178
-
179
-
180
-
181
-
182
-
183
-
184
-
185
-
186
-
187
-
188
-
189
-
190
-
191
-
192
-
193
-
194
-
195
-
196
-
197
-
198
-
199
-
200
-
201
-
202
-
203
-
204
-
205
-
206
-
207
-
208
-
209
-
210
-
211
-
212
-
213
-
214
-
215
-
216
-
217
-
218
-
219
-
220
-
221
-
222
-
223
-
224
-
225
-
226
-
227
-
228
-
229
-
230
-
231
-
232
-
233
-
234
-
235
-
236
-
237
-
238
-
239
-
240
-
241
-
242
-
243
-
244
-
245
-
246
-
247
-
248
-
249
-
250
-
251
-
252
-
253
-
254
-
255
-
256
-
257
-
258
-
259
-
260
-
261
-
262
-
263
-
264
-
265
-
266
-
267
-
268
-
269
-
270
-
271
-
272
-
273
-
274
 |
 |

Research In Motion Limited
Notes to the Consolidated Financial Statements
In millions of United States dollars, except share and per share data, and except as otherwise indicated
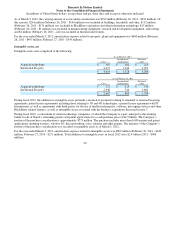
The Company defines fair value as the price that would be received to sell an asset or paid to transfer a liability in an orderly
transaction between market participants at the measurement date. When determining the fair value measurements for assets and
liabilities required to be recorded at fair value, the Company considers the principal or most advantageous market in which it
would transact and considers assumptions that market participants would use in pricing the asset or liability such as inherent
risk, non-performance risk and credit risk. The Company applies the following fair value hierarchy, which prioritizes the inputs
used in the valuation methodologies in measuring fair value into three levels:
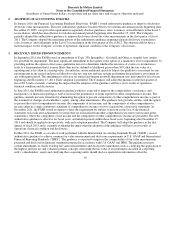
The fair value hierarchy also requires the Company to maximize the use of observable inputs and minimize the use of
unobservable inputs when measuring fair value.
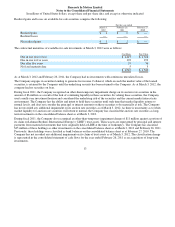
The carrying amounts of the Company’s cash and cash equivalents, accounts receivables, other receivables, accounts payable
and accrued liabilities approximate fair value due to their short maturities.
In determining the fair value of investments held, the Company primarily relies on an independent third party valuator for the
fair valuation of securities. Pricing inputs used by the independent third party valuator are generally received from two primary
vendors. The pricing inputs are reviewed for completeness and accuracy, within a set tolerance level, on a daily basis by the
third party valuator. The Company also reviews and understands the inputs used in the valuation process and assesses the pricing
of the securities for reasonableness.
The fair values of money market funds were derived from quoted prices in active markets for identical assets or liabilities.
For bankers acceptances, non-U.S. government promissory notes, term deposits/certificates and commercial paper, the
independent third party utilizes amortized cost as the short-term nature of the securities approximates fair value. For non-U.S.
treasury bills/notes, U.S. treasury bills/notes, U.S. government sponsored enterprise notes, non-U.S. government sponsored
enterprise notes, corporate notes/bonds (other than those classified as Level 3), and asset-backed securities, the independent third
party provides fair values determined from quoted prices that it obtains from vendors. The Company then corroborates the fair
values received from the independent third party against the results of its internal valuation in order to corroborate the pricing
provided by the independent third party.
The Company corroborates the fair values provided by the independent third party for bankers acceptances by comparing those
provided against fair values determined by the Company utilizing quoted prices from vendors for identical securities, or the
market prices of similar securities adjusted for observable inputs such as differences in maturity dates, interest rates, and credit
ratings. The bankers acceptances held by the Company are all issued by major banking organizations and all have investment
grade ratings.
14
5. FAIR VALUE MEASUREMENTS
•
Level 1 - Unad
j
usted
q
uoted
p
rices at the measurement date for identical assets or liabilities in active markets.
•
Level 2 - Observable inputs other than quoted prices included in Level 1, such as quoted prices for similar assets and
liabilities in active markets; quoted prices for identical or similar assets and liabilities in markets that are not active; or
other in
p
uts that are observable or can be corroborated b
y
observable market data.
•
Level 3 - Si
g
nificant unobservable in
p
uts which are su
pp
orted b
y
little or no market activit
y
.