Blackberry 2012 Annual Report Download - page 156
Download and view the complete annual report
Please find page 156 of the 2012 Blackberry annual report below. You can navigate through the pages in the report by either clicking on the pages listed below, or by using the keyword search tool below to find specific information within the annual report.-
 1
1 -
2
-
3
-
4
-
5
-
6
-
7
-
8
-
9
-
10
-
11
-
12
-
13
-
14
-
15
-
16
-
17
-
18
-
19
-
20
-
21
-
22
-
23
-
24
-
25
-
26
-
27
-
28
-
29
-
30
-
31
-
32
-
33
-
34
-
35
-
36
-
37
-
38
-
39
-
40
-
41
-
42
-
43
-
44
-
45
-
46
-
47
-
48
-
49
-
50
-
51
-
52
-
53
-
54
-
55
-
56
-
57
-
58
-
59
-
60
-
61
-
62
-
63
-
64
-
65
-
66
-
67
-
68
-
69
-
70
-
71
-
72
-
73
-
74
-
75
-
76
-
77
-
78
-
79
-
80
-
81
-
82
-
83
-
84
-
85
-
86
-
87
-
88
-
89
-
90
-
91
-
92
-
93
-
94
-
95
-
96
-
97
-
98
-
99
-
100
-
101
-
102
-
103
-
104
-
105
-
106
-
107
-
108
-
109
-
110
-
111
-
112
-
113
-
114
-
115
-
116
-
117
-
118
-
119
-
120
-
121
-
122
-
123
-
124
-
125
-
126
-
127
-
128
-
129
-
130
-
131
-
132
-
133
-
134
-
135
-
136
-
137
-
138
-
139
-
140
-
141
-
142
-
143
-
144
-
145
-
 146
146 -
 147
147 -
 148
148 -
 149
149 -
 150
150 -
 151
151 -
 152
152 -
 153
153 -
 154
154 -
 155
155 -
 156
156 -
 157
157 -
 158
158 -
 159
159 -
 160
160 -
 161
161 -
 162
162 -
 163
163 -
 164
164 -
 165
165 -
 166
166 -
167
-
168
-
169
-
170
-
171
-
172
-
173
-
174
-
175
-
176
-
177
-
178
-
179
-
180
-
181
-
182
-
183
-
184
-
185
-
186
-
187
-
188
-
189
-
190
-
191
-
192
-
193
-
194
-
195
-
196
-
197
-
198
-
199
-
200
-
201
-
202
-
203
-
204
-
205
-
206
-
207
-
208
-
209
-
210
-
211
-
212
-
213
-
214
-
215
-
216
-
217
-
218
-
219
-
220
-
221
-
222
-
223
-
224
-
225
-
226
-
227
-
228
-
229
-
230
-
231
-
232
-
233
-
234
-
235
-
236
-
237
-
238
-
239
-
240
-
241
-
242
-
243
-
244
-
245
-
246
-
247
-
248
-
249
-
250
-
251
-
252
-
253
-
254
-
255
-
256
-
257
-
258
-
259
-
260
-
261
-
262
-
263
-
264
-
265
-
266
-
267
-
268
-
269
-
270
-
271
-
272
-
273
-
274
 |
 |

Research In Motion Limited
Notes to the Consolidated Financial Statements
In millions of United States dollars, except share and per share data, and except as otherwise indicated
Treasury security for an equivalent period. In addition, the Company estimated the volatility of its common shares at the date of
grant based on a combination of the implied volatility of publicly traded options on its common shares, and historical volatility,
as the Company believes that this was a better indicator of expected volatility going forward. Finally, the expected life of stock
options granted under the plan was based on historical exercise patterns, which the Company believes were representative of
future exercise patterns.
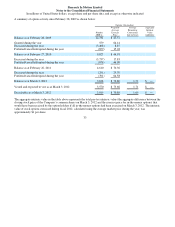
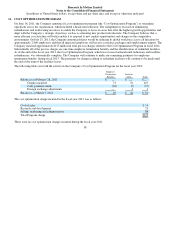
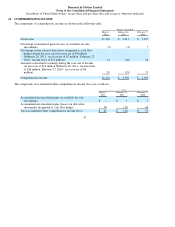
Restricted Share Unit Plan
The Company recorded compensation expense with respect to RSUs of approximately $70 million in the year ended March 3,
2012 (February 26, 2011 - $42 million; February 27, 2010 - $21 million).
During fiscal 2012, a trustee selected by the Company purchased 6,316,780 common shares for total consideration of
approximately $156 million to comply with its obligations to deliver shares upon vesting (2011 – 1,470,703 common shares
were purchased for total cash consideration of approximately $76 million). These purchased shares are classified as treasury
stock for accounting purposes and included in the shareholders’ equity section of the Company’s consolidated balance sheet.
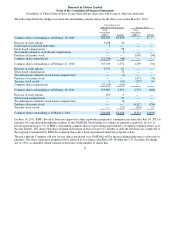
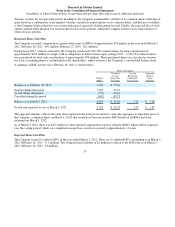
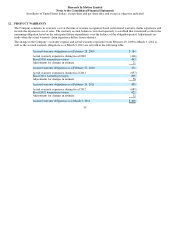
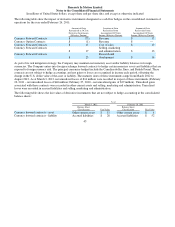
A summary of RSU activity since February 26, 2011 is shown below:
The aggregate intrinsic value in the table above represents the total pre-tax intrinsic value (the aggregate closing share price of
the Company’s common shares on March 3, 2012) that would have been received by RSU holders if all RSUs had been
redeemed on March 3, 2012.
As at March 3, 2012, there was $167 million of unrecognized compensation expense related to RSUs which will be expensed
over the vesting period, which, on a weighted-average basis, results in a period of approximately 1.6 years.
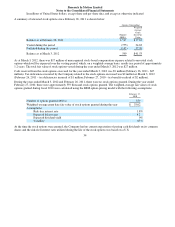
Deferred Share Unit Plan
The Company issued 0.1 million DSUs in the year ended March 3, 2012. There are 0.1 million DSUs outstanding as at March 3,
2012 (February 26, 2011 – 0.1 million). The Company had a liability of $2 million in relation to the DSU plan as at March 3,
2012 (February 26, 2011 - $3 million).
35
RSUs Outstanding
Number
(000’s)
Weighted
Average
Grant Date
Fair Value
Average
Remaining
Contractual
Life in Years
Aggregate
Intrinsic
Value
(millions)
Balance as at Februar
y
26, 2011
2,703
$57.40
Granted durin
g
the
p
eriod
7,093
25.33
Vested durin
g
the
p
eriod
(359)
60.42
Cancelled durin
g
the
p
eriod
(842) 45.73
Balance as at March 3, 2012
8,595
$31.96
1.74
$118
Vested and ex
p
ected to vest at March 3, 2012
7,952
$ 32.24
1.72
$110