Blackberry 2012 Annual Report Download - page 120
Download and view the complete annual report
Please find page 120 of the 2012 Blackberry annual report below. You can navigate through the pages in the report by either clicking on the pages listed below, or by using the keyword search tool below to find specific information within the annual report.-
 1
1 -
2
-
3
-
4
-
5
-
6
-
7
-
8
-
9
-
10
-
11
-
12
-
13
-
14
-
15
-
16
-
17
-
18
-
19
-
20
-
21
-
22
-
23
-
24
-
25
-
26
-
27
-
28
-
29
-
30
-
31
-
32
-
33
-
34
-
35
-
36
-
37
-
38
-
39
-
40
-
41
-
42
-
43
-
44
-
45
-
46
-
47
-
48
-
49
-
50
-
51
-
52
-
53
-
54
-
55
-
56
-
57
-
58
-
59
-
60
-
61
-
62
-
63
-
64
-
65
-
66
-
67
-
68
-
69
-
70
-
71
-
72
-
73
-
74
-
75
-
76
-
77
-
78
-
79
-
80
-
81
-
82
-
83
-
84
-
85
-
86
-
87
-
88
-
89
-
90
-
91
-
92
-
93
-
94
-
95
-
96
-
97
-
98
-
99
-
100
-
101
-
102
-
103
-
104
-
105
-
106
-
107
-
108
-
109
-
 110
110 -
 111
111 -
 112
112 -
 113
113 -
 114
114 -
 115
115 -
 116
116 -
 117
117 -
 118
118 -
 119
119 -
 120
120 -
 121
121 -
 122
122 -
 123
123 -
 124
124 -
 125
125 -
 126
126 -
 127
127 -
 128
128 -
 129
129 -
 130
130 -
131
-
132
-
133
-
134
-
135
-
136
-
137
-
138
-
139
-
140
-
141
-
142
-
143
-
144
-
145
-
146
-
147
-
148
-
149
-
150
-
151
-
152
-
153
-
154
-
155
-
156
-
157
-
158
-
159
-
160
-
161
-
162
-
163
-
164
-
165
-
166
-
167
-
168
-
169
-
170
-
171
-
172
-
173
-
174
-
175
-
176
-
177
-
178
-
179
-
180
-
181
-
182
-
183
-
184
-
185
-
186
-
187
-
188
-
189
-
190
-
191
-
192
-
193
-
194
-
195
-
196
-
197
-
198
-
199
-
200
-
201
-
202
-
203
-
204
-
205
-
206
-
207
-
208
-
209
-
210
-
211
-
212
-
213
-
214
-
215
-
216
-
217
-
218
-
219
-
220
-
221
-
222
-
223
-
224
-
225
-
226
-
227
-
228
-
229
-
230
-
231
-
232
-
233
-
234
-
235
-
236
-
237
-
238
-
239
-
240
-
241
-
242
-
243
-
244
-
245
-
246
-
247
-
248
-
249
-
250
-
251
-
252
-
253
-
254
-
255
-
256
-
257
-
258
-
259
-
260
-
261
-
262
-
263
-
264
-
265
-
266
-
267
-
268
-
269
-
270
-
271
-
272
-
273
-
274
 |
 |

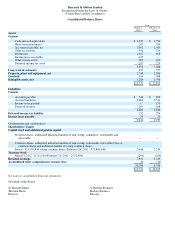
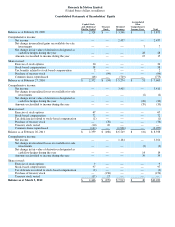
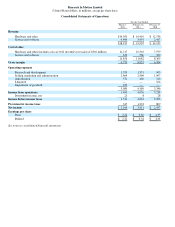
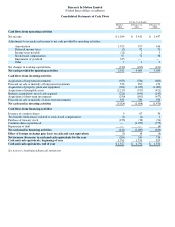
Research In Motion Limited
(United States dollars, in millions, except per share data)
Consolidated Statements of Operations
See notes to consolidated financial statements.
For the Year Ended
March 3,
2012
February 26,
2011
February 27,
2010
Revenue
Hardware and other
$14,031
$ 16,416
$ 12,536
Service and software
4,404
3,491
2,417
$18,435
$ 19,907
$ 14,953
Cost of sales
Hardware and other (includes a fiscal 2012 inventor
y
p
rovision of $502 million)
11,217
10,516
7,979
Service and software
639
566
390
11,856
11,082
8,369
Gross margin
6,579
8,825
6,584
Operating expenses
Research and develo
p
ment
1,559
1,351
965
Sellin
g
, marketin
g
and administration
2,604
2,400
1,907
Amortization
571
438
310
Liti
g
ation
—
—
164
Im
p
airment of
g
oodwill
355
—
—
5,089
4,189
3,346
Income from operations
1,490
4,636
3,238
Investment income, net
21
8
28
Income before income taxes
1,511
4,644
3,266
Provision for income taxes
347
1,233
809
Net income
$1,164
$3,411
$2,457
Earnings per share
Basic
$2.22
$6.36
$4.35
Diluted
$ 2.22
$ 6.34
$4.31