Blackberry 2012 Annual Report Download - page 210
Download and view the complete annual report
Please find page 210 of the 2012 Blackberry annual report below. You can navigate through the pages in the report by either clicking on the pages listed below, or by using the keyword search tool below to find specific information within the annual report.-
 1
1 -
2
-
3
-
4
-
5
-
6
-
7
-
8
-
9
-
10
-
11
-
12
-
13
-
14
-
15
-
16
-
17
-
18
-
19
-
20
-
21
-
22
-
23
-
24
-
25
-
26
-
27
-
28
-
29
-
30
-
31
-
32
-
33
-
34
-
35
-
36
-
37
-
38
-
39
-
40
-
41
-
42
-
43
-
44
-
45
-
46
-
47
-
48
-
49
-
50
-
51
-
52
-
53
-
54
-
55
-
56
-
57
-
58
-
59
-
60
-
61
-
62
-
63
-
64
-
65
-
66
-
67
-
68
-
69
-
70
-
71
-
72
-
73
-
74
-
75
-
76
-
77
-
78
-
79
-
80
-
81
-
82
-
83
-
84
-
85
-
86
-
87
-
88
-
89
-
90
-
91
-
92
-
93
-
94
-
95
-
96
-
97
-
98
-
99
-
100
-
101
-
102
-
103
-
104
-
105
-
106
-
107
-
108
-
109
-
110
-
111
-
112
-
113
-
114
-
115
-
116
-
117
-
118
-
119
-
120
-
121
-
122
-
123
-
124
-
125
-
126
-
127
-
128
-
129
-
130
-
131
-
132
-
133
-
134
-
135
-
136
-
137
-
138
-
139
-
140
-
141
-
142
-
143
-
144
-
145
-
146
-
147
-
148
-
149
-
150
-
151
-
152
-
153
-
154
-
155
-
156
-
157
-
158
-
159
-
160
-
161
-
162
-
163
-
164
-
165
-
166
-
167
-
168
-
169
-
170
-
171
-
172
-
173
-
174
-
175
-
176
-
177
-
178
-
179
-
180
-
181
-
182
-
183
-
184
-
185
-
186
-
187
-
188
-
189
-
190
-
191
-
192
-
193
-
194
-
195
-
196
-
197
-
198
-
199
-
 200
200 -
 201
201 -
 202
202 -
 203
203 -
 204
204 -
 205
205 -
 206
206 -
 207
207 -
 208
208 -
 209
209 -
 210
210 -
 211
211 -
 212
212 -
 213
213 -
 214
214 -
 215
215 -
 216
216 -
 217
217 -
 218
218 -
 219
219 -
 220
220 -
221
-
222
-
223
-
224
-
225
-
226
-
227
-
228
-
229
-
230
-
231
-
232
-
233
-
234
-
235
-
236
-
237
-
238
-
239
-
240
-
241
-
242
-
243
-
244
-
245
-
246
-
247
-
248
-
249
-
250
-
251
-
252
-
253
-
254
-
255
-
256
-
257
-
258
-
259
-
260
-
261
-
262
-
263
-
264
-
265
-
266
-
267
-
268
-
269
-
270
-
271
-
272
-
273
-
274
 |
 |

Research In Motion Limited
Management’s Discussion and Analysis of Financial Condition and Results of Operations
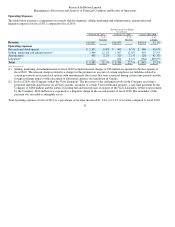
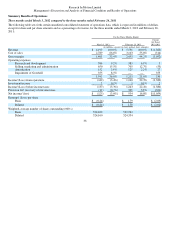
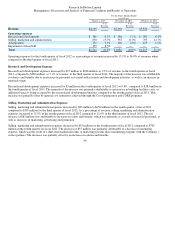
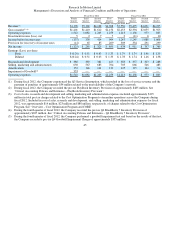
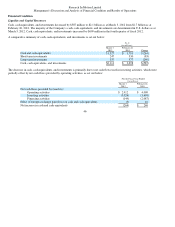
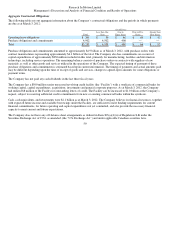
Operating expenses for the fourth quarter of fiscal 2012 as a percentage of revenue increased by 15.9% to 36.8% of revenues when
compared to the third quarter of fiscal 2012.
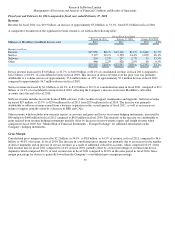
Research and Development Expense
Research and development expenses increased by $17 million to $386 million, or 9.2% of revenue, in the fourth quarter of fiscal
2012, compared to $369 million, or 7.1% of revenue, in the third quarter of fiscal 2012. The majority of the increase was attributable
to salaries and benefits due to an increase in personnel associated with research and development activities, as well as an increase in
materials usage.
Research and development expenses increased by $3 million in the fourth quarter of fiscal 2012 or 0.8%, compared to $383 million in
the fourth quarter of fiscal 2011. The majority of the increase was primarily attributable to an increase in building facilities costs, as
additional space is being occupied by the research and development functions compared to the fourth quarter of fiscal 2011. This
increase was partially offset by general cost reductions achieved through the Cost Optimization and CORE programs.
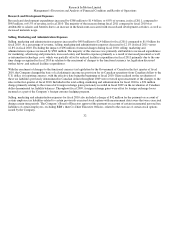
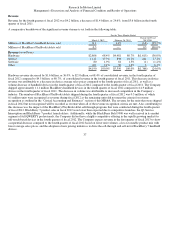
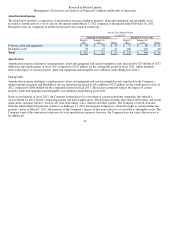
Selling, Marketing and Administration Expenses
Selling, marketing and administration expenses increased by $83 million to $650 million for the fourth quarter of fiscal 2012
compared to $567 million for the third quarter of fiscal 2012. As a percentage of revenue, selling, marketing and administration
expenses increased to 15.5% in the fourth quarter of fiscal 2012 compared to 11.0% in the third quarter of fiscal 2012. The net
increase of $83 million was attributable to increases in salary and benefits, which was primarily as a result of increased personnel, as
well as increases in marketing, advertising and promotion.
Selling, marketing and administration expenses decreased by $55 million for the fourth quarter of fiscal 2012 compared to $705
million in the fourth quarter for fiscal 2011. The decrease of $55 million was primarily attributable to a decrease in marketing
expense, which was the result of a shift from traditional forms of marketing towards direct marketing programs with the Company’s
carrier partners. The decrease was partially offset by an increase in salaries and benefits.
40
For the Three Months Ended
(in millions)
March 3, 2012 November 26, 2011 February 26, 2011
% of
Revenue
% of
Revenue
% of
Revenue
Revenue
$4,190
$5,169
$5,556
Operating expenses
Research and develo
p
ment
$386
9.2%
$369
7.1%
$383
6.9%
Sellin
g
, marketin
g
and administration
65
0
15.5%
567
11.0%
705
12.7%
Amortization
152
3.6%
146
2.8%
125
2.2%
Im
p
airment of Goodwill
355
8.5%
—
—
—
—
Total
$1,543
36.8%
$1,082
20.9%
$1,213
21.8%