Berkshire Hathaway 2011 Annual Report Download - page 93
Download and view the complete annual report
Please find page 93 of the 2011 Berkshire Hathaway annual report below. You can navigate through the pages in the report by either clicking on the pages listed below, or by using the keyword search tool below to find specific information within the annual report.-
 1
1 -
2
-
3
-
4
-
5
-
6
-
7
-
8
-
9
-
10
-
11
-
12
-
13
-
14
-
15
-
16
-
17
-
18
-
19
-
20
-
21
-
22
-
23
-
24
-
25
-
26
-
27
-
28
-
29
-
30
-
31
-
32
-
33
-
34
-
35
-
36
-
37
-
38
-
39
-
40
-
41
-
42
-
43
-
44
-
45
-
46
-
47
-
48
-
49
-
50
-
51
-
52
-
53
-
54
-
55
-
56
-
57
-
58
-
59
-
60
-
61
-
62
-
63
-
64
-
65
-
66
-
67
-
68
-
69
-
70
-
71
-
72
-
73
-
74
-
75
-
76
-
77
-
78
-
79
-
80
-
81
-
82
-
 83
83 -
 84
84 -
 85
85 -
 86
86 -
 87
87 -
 88
88 -
 89
89 -
 90
90 -
 91
91 -
 92
92 -
 93
93 -
 94
94 -
 95
95 -
 96
96 -
 97
97 -
 98
98 -
 99
99 -
 100
100 -
 101
101 -
 102
102 -
 103
103 -
104
-
105
 |
 |

Management’s Discussion (Continued)
Equity Price Risk (Continued)
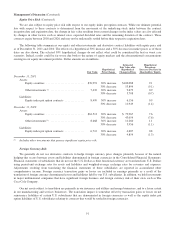
We are also subject to equity price risk with respect to our equity index put option contracts. While our ultimate potential
loss with respect to these contracts is determined from the movement of the underlying stock index between the contract
inception date and expiration date, the change in fair value resulting from current changes in the index values are also affected
by changes in other factors such as interest rates, expected dividend rates and the remaining duration of the contract. These
contracts expire between 2018 and 2026 and may not be unilaterally settled before their respective expiration dates.
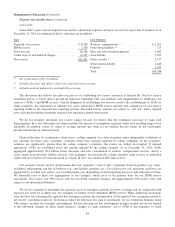
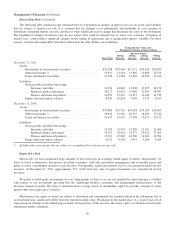
The following table summarizes our equity and other investments and derivative contract liabilities with equity price risk
as of December 31, 2011 and 2010. The effects of a hypothetical 30% increase and a 30% decrease in market prices as of those
dates are also shown. The selected 30% hypothetical changes do not reflect what could be considered the best or worst case
scenarios. Indeed, results could be far worse due both to the nature of equity markets and the aforementioned concentrations
existing in our equity investment portfolio. Dollar amounts are in millions.
Fair Value
Hypothetical
Price Change
Estimated
Fair Value after
Hypothetical
Change in Prices
Hypothetical
Percentage
Increase (Decrease) in
Shareholders’ Equity
December 31, 2011
Assets:
Equity securities ........................... $76,991 30% increase $100,088 9.1
30% decrease 53,894 (9.1)
Other investments (1) ........................ 7,432 30% increase 9,679 0.9
30% decrease 5,708 (0.7)
Liabilities:
Equity index put option contracts .............. 8,499 30% increase 6,156 0.9
30% decrease 11,949 (1.4)
December 31, 2010
Assets:
Equity securities ........................... $61,513 30% increase $ 79,967 7.6
30% decrease 43,059 (7.6)
Other investments (1) ........................ 8,668 30% increase 11,260 1.1
30% decrease 5,956 (1.1)
Liabilities:
Equity index put option contracts .............. 6,712 30% increase 4,687 0.8
30% decrease 9,859 (1.3)
(1) Includes other investments that possess significant equity price risk.
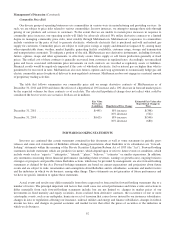
Foreign Currency Risk
We generally do not use derivative contracts to hedge foreign currency price changes primarily because of the natural
hedging that occurs between assets and liabilities denominated in foreign currencies in the Consolidated Financial Statements.
Financial statements of subsidiaries that do not use the U.S. Dollar as their functional currency are translated into U.S. Dollars
using period-end exchange rates for assets and liabilities and weighted-average exchange rates for revenues and expenses.
Adjustments resulting from translating the financial statements of these subsidiaries are reported in accumulated other
comprehensive income. Foreign currency transaction gains or losses are included in earnings primarily as a result of the
translation of foreign currency denominated assets and liabilities held by our U.S. subsidiaries. In addition, we hold investments
in major multinational companies that have significant foreign business and foreign currency risk of their own, such as The
Coca-Cola Company.
Our net assets subject to translation are primarily in our insurance and utilities and energy businesses, and to a lesser extent
in our manufacturing and services businesses. The translation impact is somewhat offset by transaction gains or losses on net
reinsurance liabilities of certain U.S. subsidiaries that are denominated in foreign currencies as well as the equity index put
option liabilities of U.S. subsidiaries relating to contracts that would be settled in foreign currencies.
91