Berkshire Hathaway 2011 Annual Report Download - page 55
Download and view the complete annual report
Please find page 55 of the 2011 Berkshire Hathaway annual report below. You can navigate through the pages in the report by either clicking on the pages listed below, or by using the keyword search tool below to find specific information within the annual report.-
 1
1 -
2
-
3
-
4
-
5
-
6
-
7
-
8
-
9
-
10
-
11
-
12
-
13
-
14
-
15
-
16
-
17
-
18
-
19
-
20
-
21
-
22
-
23
-
24
-
25
-
26
-
27
-
28
-
29
-
30
-
31
-
32
-
33
-
34
-
35
-
36
-
37
-
38
-
39
-
40
-
41
-
42
-
43
-
44
-
 45
45 -
 46
46 -
 47
47 -
 48
48 -
 49
49 -
 50
50 -
 51
51 -
 52
52 -
 53
53 -
 54
54 -
 55
55 -
 56
56 -
 57
57 -
 58
58 -
 59
59 -
 60
60 -
 61
61 -
 62
62 -
 63
63 -
 64
64 -
 65
65 -
66
-
67
-
68
-
69
-
70
-
71
-
72
-
73
-
74
-
75
-
76
-
77
-
78
-
79
-
80
-
81
-
82
-
83
-
84
-
85
-
86
-
87
-
88
-
89
-
90
-
91
-
92
-
93
-
94
-
95
-
96
-
97
-
98
-
99
-
100
-
101
-
102
-
103
-
104
-
105
 |
 |

Notes to Consolidated Financial Statements (Continued)
(17) Fair value measurements (Continued)
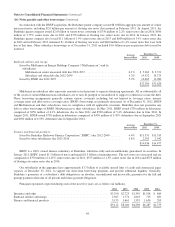
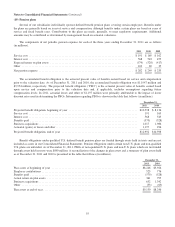
Reconciliations of assets and liabilities measured and carried at fair value on a recurring basis with the use of significant
unobservable inputs (Level 3) for each of the three years ending December 31, 2011 follow (in millions).
Investments
in fixed
maturity
securities
Investments
in equity
securities
Other
investments
Net
derivative
contract
liabilities
Balance at December 31, 2008 ...................................... $639 $328 $10,275 $(14,519)
Gains (losses) included in:
Earnings ................................................... 1 4 — 3,635
Other comprehensive income ................................... 49 25 4,702 —
Regulatory assets and liabilities ................................. — — — 47
Purchases, dispositions and settlements ............................... 244 (8) 5,637 1,664
Transfers into (out of) Level 3 ...................................... (15) (45) — (23)
Balance at December 31, 2009 ...................................... $918 $304 $20,614 $ (9,196)
Gains (losses) included in:
Earnings ................................................... — — 1,305 471
Other comprehensive income ................................... 16 (8) (358) —
Regulatory assets and liabilities ................................. — — — (33)
Purchases, dispositions and settlements ............................... 9 (1) (3,972) 533
Transfers into (out of) Level 3 ...................................... (142) (260) — 3
Balance at December 31, 2010 ...................................... $801 $ 35 $17,589 $ (8,222)
Gains (losses) included in:
Earnings ................................................... — — — (2,035)
Other comprehensive income ................................... 5 (13) (2,120) (3)
Regulatory assets and liabilities ................................. — — — 144
Purchases/Issuances .............................................. 17 — 5,000 (68)
Dispositions .................................................... (39) — — —
Settlements ..................................................... — — — 275
Transfers into (out of) Level 3 ...................................... — — (8,800) 1
Balance at December 31, 2011 ...................................... $784 $ 22 $11,669 $ (9,908)
Gains and losses included in net earnings are included as components of investment gains/losses, derivative gains/losses
and other revenues, as appropriate and are related to changes in valuations of derivative contracts and disposal or settlement
transactions.
Other investments with Level 3 measurements over the past three years included our investments in various private
placement transactions that are summarized in Note 5 to the accompanying Consolidated Financial Statements. As of March 31,
2011, we transferred our investment in GS Preferred Stock to Level 2 measurements given the then pending redemption of that
investment which occurred on April 18, 2011. As of September 30, 2011, we transferred our investment in GE Preferred Stock
from Level 3 to Level 2, as a result of the then pending redemption which occurred on October 17, 2011. Earnings in 2010
related to other investments were attributable to a gain on the redemption of the Swiss Re 12% convertible perpetual capital
instrument.
53