Berkshire Hathaway 2011 Annual Report Download - page 57
Download and view the complete annual report
Please find page 57 of the 2011 Berkshire Hathaway annual report below. You can navigate through the pages in the report by either clicking on the pages listed below, or by using the keyword search tool below to find specific information within the annual report.-
 1
1 -
2
-
3
-
4
-
5
-
6
-
7
-
8
-
9
-
10
-
11
-
12
-
13
-
14
-
15
-
16
-
17
-
18
-
19
-
20
-
21
-
22
-
23
-
24
-
25
-
26
-
27
-
28
-
29
-
30
-
31
-
32
-
33
-
34
-
35
-
36
-
37
-
38
-
39
-
40
-
41
-
42
-
43
-
44
-
45
-
46
-
 47
47 -
 48
48 -
 49
49 -
 50
50 -
 51
51 -
 52
52 -
 53
53 -
 54
54 -
 55
55 -
 56
56 -
 57
57 -
 58
58 -
 59
59 -
 60
60 -
 61
61 -
 62
62 -
 63
63 -
 64
64 -
 65
65 -
 66
66 -
 67
67 -
68
-
69
-
70
-
71
-
72
-
73
-
74
-
75
-
76
-
77
-
78
-
79
-
80
-
81
-
82
-
83
-
84
-
85
-
86
-
87
-
88
-
89
-
90
-
91
-
92
-
93
-
94
-
95
-
96
-
97
-
98
-
99
-
100
-
101
-
102
-
103
-
104
-
105
 |
 |

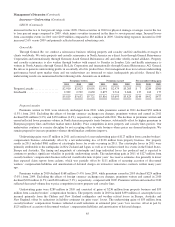
Notes to Consolidated Financial Statements (Continued)
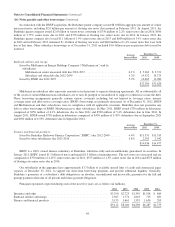
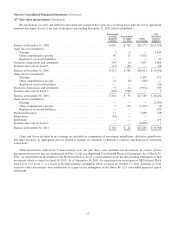
(19) Pension plans
Several of our subsidiaries individually sponsor defined benefit pension plans covering certain employees. Benefits under
the plans are generally based on years of service and compensation, although benefits under certain plans are based on years of
service and fixed benefit rates. Contributions to the plans are made, generally, to meet regulatory requirements. Additional
amounts may be contributed as determined by management based on actuarial valuations.
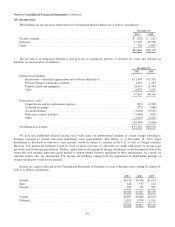
The components of net periodic pension expense for each of the three years ending December 31, 2011 are as follows
(in millions).
2011 2010 2009
Service cost ......................................................................... $191 $165 $162
Interest cost ......................................................................... 568 543 455
Expected return on plan assets .......................................................... (579) (528) (417)
Other .............................................................................. 102 69 35
Net pension expense .................................................................. $282 $249 $235
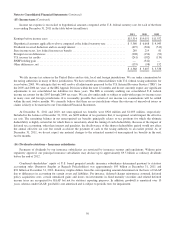
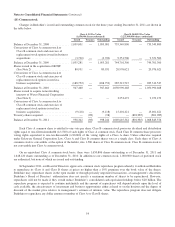
The accumulated benefit obligation is the actuarial present value of benefits earned based on service and compensation
prior to the valuation date. As of December 31, 2011 and 2010, the accumulated benefit obligation was $11,947 million and
$9,954 million, respectively. The projected benefit obligation (“PBO”) is the actuarial present value of benefits earned based
upon service and compensation prior to the valuation date and, if applicable, includes assumptions regarding future
compensation levels. In 2011, actuarial losses and other of $1,197 million were primarily attributable to the impact of lower
discount rates used in determining the PBOs. Information regarding PBOs is shown in the table that follows (in millions).
December 31,
2011 2010
Projected benefit obligation, beginning of year ................................................ $10,598 $ 8,136
Service cost ............................................................................ 191 165
Interest cost ............................................................................ 568 543
Benefits paid ........................................................................... (579) (528)
Business acquisitions ..................................................................... 1,017 1,986
Actuarial (gains) or losses and other ......................................................... 1,197 296
Projected benefit obligation, end of year ..................................................... $12,992 $10,598
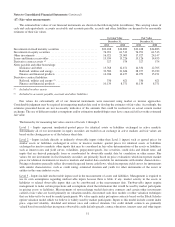
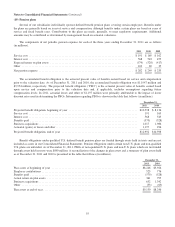
Benefit obligations under qualified U.S. defined benefit pension plans are funded through assets held in trusts and are not
included as assets in our Consolidated Financial Statements. Pension obligations under certain non-U.S. plans and non-qualified
U.S. plans are unfunded. As of December 31, 2011, PBOs of non-qualified U.S. plans and non-U.S. plans which are not funded
through assets held in trusts were $890 million. A reconciliation of the changes in plan assets and a summary of plan assets held
as of December 31, 2011 and 2010 is presented in the table that follows (in millions).
December 31,
2011 2010
Plan assets at beginning of year .............................................................. $8,246 $5,926
Employer contributions ..................................................................... 523 776
Benefits paid ............................................................................. (579) (528)
Actual return on plan assets ................................................................. 361 795
Business acquisitions ....................................................................... 632 1,342
Other ................................................................................... (33) (65)
Plan assets at end of year .................................................................... $9,150 $8,246
55