Berkshire Hathaway 2011 Annual Report Download - page 29
Download and view the complete annual report
Please find page 29 of the 2011 Berkshire Hathaway annual report below. You can navigate through the pages in the report by either clicking on the pages listed below, or by using the keyword search tool below to find specific information within the annual report.-
 1
1 -
2
-
3
-
4
-
5
-
6
-
7
-
8
-
9
-
10
-
11
-
12
-
13
-
14
-
15
-
16
-
17
-
18
-
 19
19 -
 20
20 -
 21
21 -
 22
22 -
 23
23 -
 24
24 -
 25
25 -
 26
26 -
 27
27 -
 28
28 -
 29
29 -
 30
30 -
 31
31 -
 32
32 -
 33
33 -
 34
34 -
 35
35 -
 36
36 -
 37
37 -
 38
38 -
 39
39 -
40
-
41
-
42
-
43
-
44
-
45
-
46
-
47
-
48
-
49
-
50
-
51
-
52
-
53
-
54
-
55
-
56
-
57
-
58
-
59
-
60
-
61
-
62
-
63
-
64
-
65
-
66
-
67
-
68
-
69
-
70
-
71
-
72
-
73
-
74
-
75
-
76
-
77
-
78
-
79
-
80
-
81
-
82
-
83
-
84
-
85
-
86
-
87
-
88
-
89
-
90
-
91
-
92
-
93
-
94
-
95
-
96
-
97
-
98
-
99
-
100
-
101
-
102
-
103
-
104
-
105
 |
 |

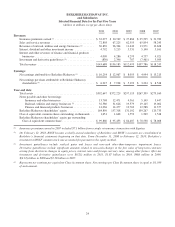
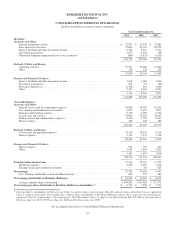
BERKSHIRE HATHAWAY INC.
and Subsidiaries
CONSOLIDATED STATEMENTS OF EARNINGS
(dollars in millions except per-share amounts)
Year Ended December 31,
2011 2010 2009
Revenues:
Insurance and Other:
Insurance premiums earned ...................................................... $ 32,075 $ 30,749 $ 27,884
Sales and service revenues ....................................................... 72,803 67,225 62,555
Interest, dividend and other investment income ....................................... 4,792 5,215 5,531
Investment gains/losses .......................................................... 1,973 4,044 358
Other-than-temporary impairment losses on investments ............................... (908) (1,973) (3,155)
110,735 105,260 93,173
Railroad, Utilities and Energy:
Operating revenues ............................................................. 30,721 26,186 11,204
Other ........................................................................ 118 178 239
30,839 26,364 11,443
Finance and Financial Products:
Interest, dividend and other investment income ....................................... 1,618 1,683 1,600
Investment gains/losses .......................................................... 209 14 (40)
Derivative gains/losses .......................................................... (2,104) 261 3,624
Other ........................................................................ 2,391 2,603 2,693
2,114 4,561 7,877
143,688 136,185 112,493
Costs and expenses:
Insurance and Other:
Insurance losses and loss adjustment expenses ....................................... 20,829 18,087 18,251
Life, annuity and health insurance benefits .......................................... 4,879 4,453 1,937
Insurance underwriting expenses .................................................. 6,119 6,196 6,236
Cost of sales and services ........................................................ 59,839 55,585 52,647
Selling, general and administrative expenses ......................................... 8,670 7,704 8,117
Interest expense ................................................................ 308 278 189
100,644 92,303 87,377
Railroad, Utilities and Energy:
Cost of sales and operating expenses ............................................... 22,736 19,637 8,739
Interest expense ................................................................ 1,703 1,577 1,176
24,439 21,214 9,915
Finance and Financial Products:
Interest expense ................................................................ 653 703 627
Other ........................................................................ 2,638 2,914 3,022
3,291 3,617 3,649
128,374 117,134 100,941
Earnings before income taxes ....................................................... 15,314 19,051 11,552
Income tax expense ............................................................. 4,568 5,607 3,538
Earnings from equity method investments ........................................... — 50 427
Net earnings ...................................................................... 10,746 13,494 8,441
Less: Earnings attributable to noncontrolling interests .................................. 492 527 386
Net earnings attributable to Berkshire Hathaway ....................................... $ 10,254 $ 12,967 $ 8,055
Average common shares outstanding * ............................................. 1,649,891 1,635,661 1,551,174
Net earnings per share attributable to Berkshire Hathaway shareholders * ................. $ 6,215 $ 7,928 $ 5,193
* Average shares outstanding include average Class A common shares and average Class B common shares determined on an equivalent
Class A common stock basis. Net earnings per common share attributable to Berkshire Hathaway shown above represents net earnings per
equivalent Class A common share. Net earnings per Class B common share is equal to one-fifteen-hundredth (1/1,500) of such amount or
$4.14 per share for 2011, $5.29 per share for 2010 and $3.46 per share for 2009.
See accompanying Notes to Consolidated Financial Statements
27