Berkshire Hathaway 2011 Annual Report Download - page 49
Download and view the complete annual report
Please find page 49 of the 2011 Berkshire Hathaway annual report below. You can navigate through the pages in the report by either clicking on the pages listed below, or by using the keyword search tool below to find specific information within the annual report.-
 1
1 -
2
-
3
-
4
-
5
-
6
-
7
-
8
-
9
-
10
-
11
-
12
-
13
-
14
-
15
-
16
-
17
-
18
-
19
-
20
-
21
-
22
-
23
-
24
-
25
-
26
-
27
-
28
-
29
-
30
-
31
-
32
-
33
-
34
-
35
-
36
-
37
-
38
-
 39
39 -
 40
40 -
 41
41 -
 42
42 -
 43
43 -
 44
44 -
 45
45 -
 46
46 -
 47
47 -
 48
48 -
 49
49 -
 50
50 -
 51
51 -
 52
52 -
 53
53 -
 54
54 -
 55
55 -
 56
56 -
 57
57 -
 58
58 -
 59
59 -
60
-
61
-
62
-
63
-
64
-
65
-
66
-
67
-
68
-
69
-
70
-
71
-
72
-
73
-
74
-
75
-
76
-
77
-
78
-
79
-
80
-
81
-
82
-
83
-
84
-
85
-
86
-
87
-
88
-
89
-
90
-
91
-
92
-
93
-
94
-
95
-
96
-
97
-
98
-
99
-
100
-
101
-
102
-
103
-
104
-
105
 |
 |

Notes to Consolidated Financial Statements (Continued)
(13) Unpaid losses and loss adjustment expenses (Continued)
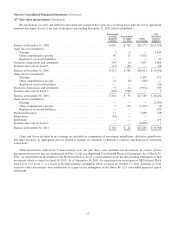
Incurred losses recorded during the current year but attributable to a prior accident year (“prior accident years”) reflects the
amount of estimation error charged or credited to earnings in each calendar year with respect to the liabilities established as of
the beginning of that year. We reduced the beginning of the year net losses and loss adjustment expenses liability by
$2,544 million in 2011, $2,626 million in 2010 and $1,507 million in 2009, which excludes the effects of prior years’ discount
accretion and deferred charge amortization referred to below. In 2011, the reduction in prior years’ liability estimates were
primarily due to reductions in expected losses with respect to certain retroactive reinsurance contracts, as well as to lower than
expected loss development in 2011 under primary private passenger auto and medical malpractice liabilities and casualty
reinsurance liabilities business. In 2010 and 2009, the reductions in estimates for prior years’ were primarily due to lower than
previously expected private passenger auto, commercial auto and medical malpractice losses, as well as lower than expected
reported reinsurance losses in both property and casualty lines. Accident year loss estimates are regularly adjusted to consider
emerging loss development patterns of prior years’ losses, whether favorable or unfavorable.
Incurred losses for prior accident years also include amortization of deferred charges related to retroactive reinsurance
contracts incepting prior to the beginning of the year and the accretion of the net discounts recorded on liabilities for certain
workers’ compensation claims. Amortization charges included in prior accident years’ incurred losses were $249 million in
2011, $261 million in 2010 and $504 million in 2009. Net discounted workers’ compensation liabilities at December 31, 2011
and 2010 were $2,250 million and $2,315 million, respectively, reflecting net discounts of $2,130 million and $2,269 million,
respectively. The accretion of discounted liabilities related to prior accident years’ incurred losses was approximately
$93 million in 2011, $95 million in 2010 and $98 million in 2009.
We are exposed to environmental, asbestos and other latent injury claims arising from insurance and reinsurance contracts.
Liability estimates for environmental and asbestos exposures include case basis reserves and also reflect reserves for legal and
other loss adjustment expenses and IBNR reserves. IBNR reserves are determined based upon our historic general liability
exposure base and policy language, previous environmental loss experience and the assessment of current trends of
environmental law, environmental cleanup costs, asbestos liability law and judgmental settlements of asbestos liabilities.
The liabilities for environmental, asbestos and latent injury claims and claims expenses net of reinsurance recoverables
were approximately $13.9 billion at December 31, 2011 and $12.4 billion at December 31, 2010. These liabilities included
approximately $12.3 billion at December 31, 2011 and $10.7 billion at December 31, 2010 of liabilities assumed under
retroactive reinsurance contracts. The increase in liabilities in 2011 was primarily due to new retroactive reinsurance contracts
entered into in 2011. Liabilities arising from retroactive contracts with exposure to claims of this nature are generally subject to
aggregate policy limits. Thus, our exposure to environmental and latent injury claims under these contracts is, likewise, limited.
We monitor evolving case law and its effect on environmental and latent injury claims. Changing government regulations,
newly identified toxins, newly reported claims, new theories of liability, new contract interpretations and other factors could
result in significant increases in these liabilities. Such development could be material to our results of operations. We are unable
to reliably estimate the amount of additional net loss or the range of net loss that is reasonably possible.
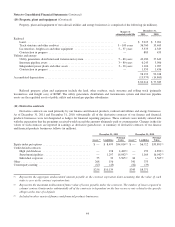
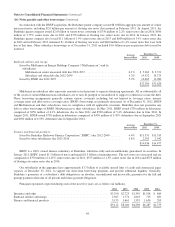
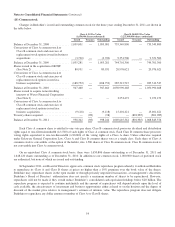
(14) Notes payable and other borrowings
Notes payable and other borrowings are summarized below (in millions). The average interest rates shown in the following
tables are the weighted average interest rates on outstanding debt as of December 31, 2011. Maturity date ranges are based on
borrowings as of December 31, 2011.
Average
Interest Rate
December 31,
2011 2010
Insurance and other:
Issued by Berkshire parent company due 2012-2047 ............................. 2.0% $ 8,287 $ 8,360
Short-term subsidiary borrowings ............................................ 0.2% 1,490 1,682
Other subsidiary borrowings due 2012-2036 ................................... 5.9% 3,991 2,429
$13,768 $12,471
47