Berkshire Hathaway 2011 Annual Report Download - page 41
Download and view the complete annual report
Please find page 41 of the 2011 Berkshire Hathaway annual report below. You can navigate through the pages in the report by either clicking on the pages listed below, or by using the keyword search tool below to find specific information within the annual report.-
 1
1 -
2
-
3
-
4
-
5
-
6
-
7
-
8
-
9
-
10
-
11
-
12
-
13
-
14
-
15
-
16
-
17
-
18
-
19
-
20
-
21
-
22
-
23
-
24
-
25
-
26
-
27
-
28
-
29
-
30
-
 31
31 -
 32
32 -
 33
33 -
 34
34 -
 35
35 -
 36
36 -
 37
37 -
 38
38 -
 39
39 -
 40
40 -
 41
41 -
 42
42 -
 43
43 -
 44
44 -
 45
45 -
 46
46 -
 47
47 -
 48
48 -
 49
49 -
 50
50 -
 51
51 -
52
-
53
-
54
-
55
-
56
-
57
-
58
-
59
-
60
-
61
-
62
-
63
-
64
-
65
-
66
-
67
-
68
-
69
-
70
-
71
-
72
-
73
-
74
-
75
-
76
-
77
-
78
-
79
-
80
-
81
-
82
-
83
-
84
-
85
-
86
-
87
-
88
-
89
-
90
-
91
-
92
-
93
-
94
-
95
-
96
-
97
-
98
-
99
-
100
-
101
-
102
-
103
-
104
-
105
 |
 |

Notes to Consolidated Financial Statements (Continued)
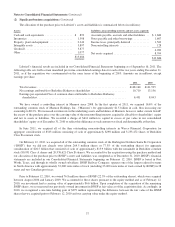
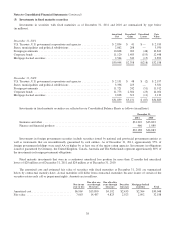
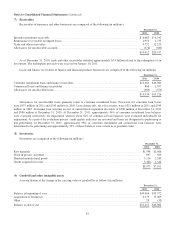
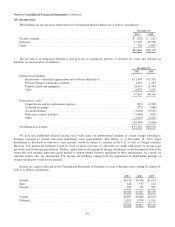
(4) Investments in equity securities
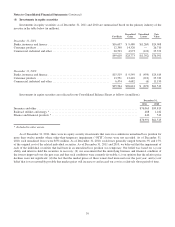
Investments in equity securities as of December 31, 2011 and 2010 are summarized based on the primary industry of the
investee in the table below (in millions).
Cost Basis
Unrealized
Gains
Unrealized
Losses
Fair
Value
December 31, 2011
Banks, insurance and finance ........................................... $16,697 $ 9,480 $(1,269) $24,908
Consumer products ................................................... 12,390 14,320 — 26,710
Commercial, industrial and other ........................................ 20,523 4,973 (123) 25,373
$49,610 $28,773 $(1,392) $76,991
December 31, 2010
Banks, insurance and finance ........................................... $15,519 $ 9,549 $ (454) $24,614
Consumer products ................................................... 13,551 12,410 (212) 25,749
Commercial, industrial and other ........................................ 6,474 4,682 (6) 11,150
$35,544 $26,641 $ (672) $61,513
Investments in equity securities are reflected in our Consolidated Balance Sheets as follows (in millions).
December 31,
2011 2010
Insurance and other ...................................................................... $76,063 $59,819
Railroad, utilities and energy * ............................................................. 488 1,182
Finance and financial products * ............................................................ 440 512
$76,991 $61,513
* Included in other assets.
As of December 31, 2011, there were no equity security investments that were in a continuous unrealized loss position for
more than twelve months where other-than-temporary impairment (“OTTI”) losses were not recorded. As of December 31,
2010, such unrealized losses were $531 million. As of December 31, 2010, such losses generally ranged between 3% and 15%
of the original cost of the related individual securities. As of December 31, 2011 and 2010, we believed that the impairment of
each of the individual securities that had been in an unrealized loss position was temporary. Our belief was based on: (a) our
ability and intent to hold the securities to recovery; (b) our assessment that the underlying business and financial condition of
the issuers improved over the past year and that such conditions were currently favorable; (c) our opinion that the relative price
declines were not significant; (d) the fact that the market prices of these issuers had increased over the past year; and (e) our
belief that it was reasonably possible that market prices will increase to and exceed our cost in a relatively short period of time.
39