Berkshire Hathaway 2011 Annual Report Download - page 66
Download and view the complete annual report
Please find page 66 of the 2011 Berkshire Hathaway annual report below. You can navigate through the pages in the report by either clicking on the pages listed below, or by using the keyword search tool below to find specific information within the annual report.-
 1
1 -
2
-
3
-
4
-
5
-
6
-
7
-
8
-
9
-
10
-
11
-
12
-
13
-
14
-
15
-
16
-
17
-
18
-
19
-
20
-
21
-
22
-
23
-
24
-
25
-
26
-
27
-
28
-
29
-
30
-
31
-
32
-
33
-
34
-
35
-
36
-
37
-
38
-
39
-
40
-
41
-
42
-
43
-
44
-
45
-
46
-
47
-
48
-
49
-
50
-
51
-
52
-
53
-
54
-
55
-
 56
56 -
 57
57 -
 58
58 -
 59
59 -
 60
60 -
 61
61 -
 62
62 -
 63
63 -
 64
64 -
 65
65 -
 66
66 -
 67
67 -
 68
68 -
 69
69 -
 70
70 -
 71
71 -
 72
72 -
 73
73 -
 74
74 -
 75
75 -
 76
76 -
77
-
78
-
79
-
80
-
81
-
82
-
83
-
84
-
85
-
86
-
87
-
88
-
89
-
90
-
91
-
92
-
93
-
94
-
95
-
96
-
97
-
98
-
99
-
100
-
101
-
102
-
103
-
104
-
105
 |
 |

Management’s Discussion (Continued)
Insurance—Underwriting (Continued)
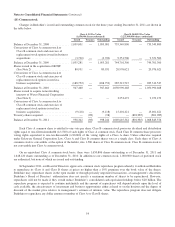
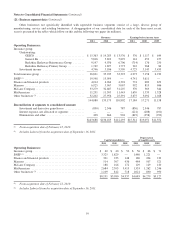
GEICO
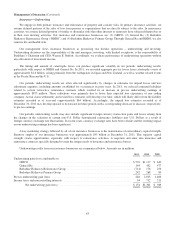
Through GEICO, we primarily write private passenger automobile insurance, offering coverages to insureds in all 50 states
and the District of Columbia. GEICO’s policies are marketed mainly by direct response methods in which customers apply for
coverage directly to the company via the Internet or over the telephone. This is a significant element in our strategy to be a
low-cost auto insurer. In addition, we strive to provide excellent service to customers, with the goal of establishing long-term
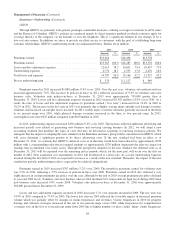
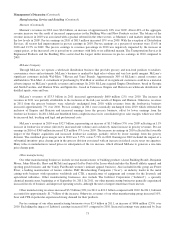
customer relationships. GEICO’s underwriting results are summarized below. Dollars are in millions.
2011 2010 2009
Amount % Amount % Amount %
Premiums written ........................................... $15,664 $14,494 $13,758
Premiums earned ............................................ $15,363 100.0 $14,283 100.0 $13,576 100.0
Losses and loss adjustment expenses ............................ 12,013 78.2 10,631 74.4 10,457 77.0
Underwriting expenses ....................................... 2,774 18.1 2,535 17.8 2,470 18.2
Total losses and expenses ..................................... 14,787 96.3 13,166 92.2 12,927 95.2
Pre-tax underwriting gain ..................................... $ 576 $ 1,117 $ 649
Premiums earned in 2011 increased $1,080 million (7.6%) over 2010. Over the past year, voluntary auto policies-in-force
increased approximately 7.0%. The increase in policies-in-force in 2011 reflected an increase of 9.4% in voluntary auto new
business sales. Voluntary auto policies-in-force at December 31, 2011 were approximately 709,000 greater than at
December 31, 2010. Losses and loss adjustment expenses incurred in 2011 increased $1,382 million (13.0%) over 2010. As a
result, the ratio of losses and loss adjustment expenses to premiums earned (“loss ratio”) increased from 74.4% in 2010 to
78.2% in 2011. The increase in the loss ratio in 2011 was primarily due to higher average injury and physical damage severities
estimates and increased catastrophe losses incurred. In 2011, bodily injury severities estimates generally increased in the three
to six percent range over 2010, while physical damage severities increased in the three to five percent range. In 2011,
catastrophe losses were $252 million compared with $109 million in 2010.
In 2011, underwriting expenses increased $239 million (9.4%) over 2010. The increase reflected additional advertising and
increased payroll costs related to generating new business and servicing existing business. In 2012, we will adopt a new
accounting standard that modifies the types of costs that may be deferred in acquiring or renewing insurance policies. We
anticipate that the impact of adopting this new standard on the Berkshire insurance group will be concentrated in GEICO, which
will cease deferring a significant portion of its direct advertising costs. If the new standard had been in effect as of
December 31, 2011, we estimate that GEICO’s deferred costs as of that date would have been reduced by approximately $350
million with a corresponding reduction in retained earnings of approximately $230 million (represents the after-tax impact on
earnings that accumulated over many years). Through the prospective adoption of the new standard, the deferred costs as of
December 31, 2011 will be expensed over the remaining policy periods, which, for the most part, will occur over the first six
months of 2012. New acquisition cost expenditures in 2012 will be deferred at a lower rate. As a result, underwriting expenses
incurred during the first half of 2012 are expected to increase as a result of the new standard. Thereafter, the impact of the new
standard on periodic underwriting results is expected to be relatively insignificant.
Premiums earned in 2010 increased $707 million (5.2%) over 2009. The growth in premiums earned for voluntary auto
was 5.3% in 2010, reflecting a 5.9% increase in policies-in-force over 2009. Premiums earned in 2010 also reflected a very
slight increase in average premiums per policy over the year, although by the end of 2010 average premiums per policy declined
to year-end 2009 levels. Voluntary auto new business sales in 2010 declined 2.6% from relatively high levels during 2009 when
new business sales increased 9.0% versus 2008. Voluntary auto policies-in-force at December 31, 2010 were approximately
563,000 greater than at December 31, 2009.
Losses and loss adjustment expenses incurred in 2010 increased 1.7% over amounts incurred in 2009. The loss ratio was
74.4% in 2010 compared to 77.0% in 2009. The lower loss ratio in 2010 reflected the favorable impact of increased premium
volume which was partially offset by changes in claims frequencies and severities. Claims frequencies in 2010 for property
damage and collision coverages increased in the one to two percent range versus 2009, while frequencies for comprehensive
coverages rose in the five to seven percent range from 2009 due to higher numbers of glass claims. Injury claims frequencies
64