Berkshire Hathaway 2011 Annual Report Download - page 18
Download and view the complete annual report
Please find page 18 of the 2011 Berkshire Hathaway annual report below. You can navigate through the pages in the report by either clicking on the pages listed below, or by using the keyword search tool below to find specific information within the annual report.-
 1
1 -
2
-
3
-
4
-
5
-
6
-
7
-
 8
8 -
 9
9 -
 10
10 -
 11
11 -
 12
12 -
 13
13 -
 14
14 -
 15
15 -
 16
16 -
 17
17 -
 18
18 -
 19
19 -
 20
20 -
 21
21 -
 22
22 -
 23
23 -
 24
24 -
 25
25 -
 26
26 -
 27
27 -
 28
28 -
29
-
30
-
31
-
32
-
33
-
34
-
35
-
36
-
37
-
38
-
39
-
40
-
41
-
42
-
43
-
44
-
45
-
46
-
47
-
48
-
49
-
50
-
51
-
52
-
53
-
54
-
55
-
56
-
57
-
58
-
59
-
60
-
61
-
62
-
63
-
64
-
65
-
66
-
67
-
68
-
69
-
70
-
71
-
72
-
73
-
74
-
75
-
76
-
77
-
78
-
79
-
80
-
81
-
82
-
83
-
84
-
85
-
86
-
87
-
88
-
89
-
90
-
91
-
92
-
93
-
94
-
95
-
96
-
97
-
98
-
99
-
100
-
101
-
102
-
103
-
104
-
105
 |
 |

In 2007, the bubble burst, just as all bubbles must. We are now in the fourth year of a cure that, though
long and painful, is sure to succeed. Today, household formations are consistently exceeding housing starts.
Clayton’s earnings should improve materially when the nation’s excess housing inventory is worked
off. As I see things today, however, I believe the intrinsic value of the three businesses in this sector does not
differ materially from their book value.
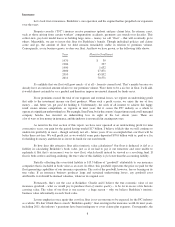
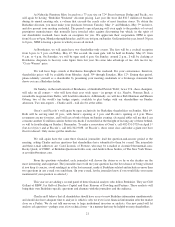
Investments
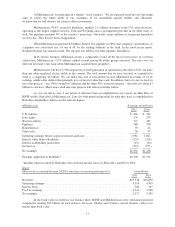
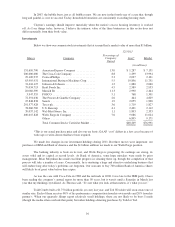
Below we show our common stock investments that at yearend had a market value of more than $1 billion.
12/31/11
Shares Company
Percentage of
Company
Owned
Cost* Market
(in millions)
151,610,700 American Express Company ............. 13.0 $ 1,287 $ 7,151
200,000,000 The Coca-Cola Company ................ 8.8 1,299 13,994
29,100,937 ConocoPhillips ........................ 2.3 2,027 2,121
63,905,931 International Business Machines Corp. ..... 5.5 10,856 11,751
31,416,127 Johnson & Johnson ..................... 1.2 1,880 2,060
79,034,713 Kraft Foods Inc. ....................... 4.5 2,589 2,953
20,060,390 Munich Re ........................... 11.3 2,990 2,464
3,947,555 POSCO .............................. 5.1 768 1,301
72,391,036 The Procter & Gamble Company .......... 2.6 464 4,829
25,848,838 Sanofi ............................... 1.9 2,055 1,900
291,577,428 Tesco plc ............................. 3.6 1,719 1,827
78,060,769 U.S. Bancorp ......................... 4.1 2,401 2,112
39,037,142 Wal-Mart Stores, Inc. ................... 1.1 1,893 2,333
400,015,828 Wells Fargo & Company ................ 7.6 9,086 11,024
Others ............................... 6,895 9,171
Total Common Stocks Carried at Market .... $48,209 $76,991
*This is our actual purchase price and also our tax basis; GAAP “cost” differs in a few cases because of
write-ups or write-downs that have been required.
We made few changes in our investment holdings during 2011. But three moves were important: our
purchases of IBM and Bank of America and the $1 billion addition we made to our Wells Fargo position.
The banking industry is back on its feet, and Wells Fargo is prospering. Its earnings are strong, its
assets solid and its capital at record levels. At Bank of America, some huge mistakes were made by prior
management. Brian Moynihan has made excellent progress in cleaning these up, though the completion of that
process will take a number of years. Concurrently, he is nurturing a huge and attractive underlying business that
will endure long after today’s problems are forgotten. Our warrants to buy 700 million Bank of America shares
will likely be of great value before they expire.
As was the case with Coca-Cola in 1988 and the railroads in 2006, I was late to the IBM party. I have
been reading the company’s annual report for more than 50 years, but it wasn’t until a Saturday in March last
year that my thinking crystallized. As Thoreau said, “It’s not what you look at that matters, it’s what you see.”
Todd Combs built a $1.75 billion portfolio (at cost) last year, and Ted Weschler will soon create one of
similar size. Each of them receives 80% of his performance compensation from his own results and 20% from his
partner’s. When our quarterly filings report relatively small holdings, these are not likely to be buys I made
(though the media often overlook that point) but rather holdings denoting purchases by Todd or Ted.
16