Berkshire Hathaway 2011 Annual Report Download - page 86
Download and view the complete annual report
Please find page 86 of the 2011 Berkshire Hathaway annual report below. You can navigate through the pages in the report by either clicking on the pages listed below, or by using the keyword search tool below to find specific information within the annual report.-
 1
1 -
2
-
3
-
4
-
5
-
6
-
7
-
8
-
9
-
10
-
11
-
12
-
13
-
14
-
15
-
16
-
17
-
18
-
19
-
20
-
21
-
22
-
23
-
24
-
25
-
26
-
27
-
28
-
29
-
30
-
31
-
32
-
33
-
34
-
35
-
36
-
37
-
38
-
39
-
40
-
41
-
42
-
43
-
44
-
45
-
46
-
47
-
48
-
49
-
50
-
51
-
52
-
53
-
54
-
55
-
56
-
57
-
58
-
59
-
60
-
61
-
62
-
63
-
64
-
65
-
66
-
67
-
68
-
69
-
70
-
71
-
72
-
73
-
74
-
75
-
 76
76 -
 77
77 -
 78
78 -
 79
79 -
 80
80 -
 81
81 -
 82
82 -
 83
83 -
 84
84 -
 85
85 -
 86
86 -
 87
87 -
 88
88 -
 89
89 -
 90
90 -
 91
91 -
 92
92 -
 93
93 -
 94
94 -
 95
95 -
 96
96 -
97
-
98
-
99
-
100
-
101
-
102
-
103
-
104
-
105
 |
 |

Management’s Discussion (Continued)
Property and casualty losses (Continued)
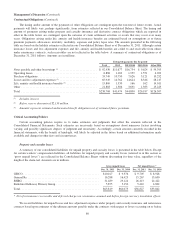
General Re
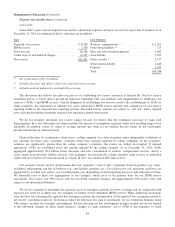
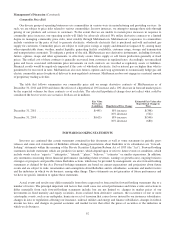
General Re’s gross and net unpaid losses and loss adjustment expenses and gross reserves by major line of business as of
December 31, 2011 are summarized below. Amounts are in millions.
Type Line of business
Reported case reserves ........................ $ 8,528 Workers’ compensation (1) ................... $ 2,955
IBNR reserves ............................... 7,760 Professional liability (2) ...................... 723
Gross reserves ............................... 16,288 Mass tort-asbestos/environmental .............. 1,642
Ceded reserves and deferred charges ............. (1,021) Auto liability .............................. 3,093
Net reserves ................................. $15,267 Other casualty (3) ........................... 2,277
Other general liability ....................... 2,648
Property .................................. 2,950
Total .................................... $16,288
(1) Net of discounts of $2,130 million.
(2) Includes directors and officers and errors and omissions coverage.
(3) Includes medical malpractice and umbrella coverage.
The discussion that follows describes our process of establishing loss reserve estimates at General Re. Our loss reserve
estimation process is based upon a ground-up approach, beginning with case estimates and supplemented by additional case
reserves (“ACRs”) and IBNR reserves. Critical judgments in establishing loss reserves involve the establishment of ACRs by
claim examiners, the expectation of ultimate loss ratios which drive IBNR reserve amounts and comparison of case reserve
reporting trends to the expected loss reporting patterns. Recorded reserve amounts are subject to “tail risk” where reported
losses develop beyond the maximum expected loss emergence pattern time period.
We do not routinely determine loss reserve ranges because we believe that the techniques necessary to make such
determinations have not sufficiently developed and that the myriad of assumptions required render such resulting ranges to be
unreliable. In addition, counts of claims or average amounts per claim are not utilized because clients do not consistently
provide reliable data in sufficient detail.
Upon notification of a reinsurance claim from a ceding company, our claim examiners make independent evaluations of
loss amounts. In some cases, examiners’ estimates differ from amounts reported by ceding companies. If the examiners’
estimates are significantly greater than the ceding company’s estimates, the claims are further investigated. If deemed
appropriate, ACRs are established above the amount reported by the ceding company. As of December 31, 2011, ACRs
aggregated approximately $2.6 billion before discounts and were concentrated in workers’ compensation reserves, and to a
lesser extent in professional liability reserves. Our examiners also periodically conduct detailed claim reviews of individual
clients and case reserves are often increased as a result. In 2011, we conducted 288 claim reviews.
Our actuaries classify all loss and premium data into segments (“reserve cells”) primarily based on product (e.g., treaty,
facultative and program) and line of business (e.g., auto liability, property, etc.). For each reserve cell, premiums and losses are
aggregated by accident year, policy year or underwriting year (depending on client reporting practices) and analyzed over time.
We internally refer to these loss aggregations as loss triangles, which serve as the primary basis for our IBNR reserve
calculations. We review over 300 reserve cells for our North American business and approximately 900 reserve cells with
respect to our international business.
We use loss triangles to determine the expected case loss emergence patterns for most coverages and, in conjunction with
expected loss ratios by accident year, loss triangles are further used to determine IBNR reserves. While additional calculations
form the basis for estimating the expected loss emergence pattern, the determination of the expected loss emergence pattern is
not strictly a mechanical process. In instances where the historical loss data is insufficient, we use estimation formulas along
with reliance on other loss triangles and judgment. Factors affecting our loss development triangles include but are not limited
to the following: changes in client claims practices, changes in claim examiners’ use of ACRs or the frequency of client
84