Berkshire Hathaway 2011 Annual Report Download - page 90
Download and view the complete annual report
Please find page 90 of the 2011 Berkshire Hathaway annual report below. You can navigate through the pages in the report by either clicking on the pages listed below, or by using the keyword search tool below to find specific information within the annual report.-
 1
1 -
2
-
3
-
4
-
5
-
6
-
7
-
8
-
9
-
10
-
11
-
12
-
13
-
14
-
15
-
16
-
17
-
18
-
19
-
20
-
21
-
22
-
23
-
24
-
25
-
26
-
27
-
28
-
29
-
30
-
31
-
32
-
33
-
34
-
35
-
36
-
37
-
38
-
39
-
40
-
41
-
42
-
43
-
44
-
45
-
46
-
47
-
48
-
49
-
50
-
51
-
52
-
53
-
54
-
55
-
56
-
57
-
58
-
59
-
60
-
61
-
62
-
63
-
64
-
65
-
66
-
67
-
68
-
69
-
70
-
71
-
72
-
73
-
74
-
75
-
76
-
77
-
78
-
79
-
 80
80 -
 81
81 -
 82
82 -
 83
83 -
 84
84 -
 85
85 -
 86
86 -
 87
87 -
 88
88 -
 89
89 -
 90
90 -
 91
91 -
 92
92 -
 93
93 -
 94
94 -
 95
95 -
 96
96 -
 97
97 -
 98
98 -
 99
99 -
 100
100 -
101
-
102
-
103
-
104
-
105
 |
 |

Management’s Discussion (Continued)
Derivative contract liabilities (Continued)
issuer credit default contracts, our fair values are generally based on credit default spread information obtained from our
reporting sources. We monitor and review pricing and spread data for consistency as well as reasonableness with respect to
current market conditions. We make no significant adjustments to the pricing data obtained. Further, we make no significant
adjustments to fair values for non-performance risk. We concluded that the values produced from this data (without adjustment)
reasonably represented the values for which we could have transferred these liabilities. Prices in a current actual settlement
could differ significantly from the fair values used in the financial statements. We do not operate as a derivatives dealer and
currently we do not utilize offsetting strategies to hedge these contracts. We intend to allow our credit default contracts to run
off to their respective expiration dates.
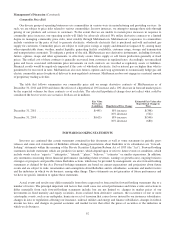
We determine the estimated fair value of equity index put option contracts based on the widely used Black-Scholes based
option valuation model. Inputs to the model include the current index value, strike price, discount rate, dividend rate and
contract expiration date. The weighted average discount and dividend rates used as of December 31, 2011 were 3.3% and 3.0%,
respectively, and were approximately 3.7% and 2.9%, respectively, as of December 31, 2010. The discount rates
as of December 31, 2011 and 2010 were approximately 153 basis points and 82 basis points (on a weighted average basis),
respectively, over benchmark interest rates and represented an estimate of the spread between our borrowing rates and
the benchmark rates for comparable durations. The spread adjustments were based on spreads for our obligations and
obligations for comparably rated issuers. We believe the most significant economic risks relate to changes in the index value
component and to a lesser degree to the foreign currency component.
The Black-Scholes based model also incorporates volatility estimates that measure potential price changes over time. Our
contracts have an average remaining maturity of about 9 years. The weighted average volatility used as of December 31, 2011
was approximately 21.4%, which was relatively unchanged from 2010. The weighted average volatilities are based on the
volatility input for each equity index put option contract weighted by the notional value of each equity index put option contract
as compared to the aggregate notional value of all equity index put option contracts. The volatility input for each equity index
put option contract is based upon the implied volatility at the inception of each equity index put option contract. The impact on
fair value as of December 31, 2011 ($8.5 billion) from changes in volatility is summarized below. The values of contracts in an
actual exchange are affected by market conditions and perceptions of the buyers and sellers. Actual values in an exchange may
differ significantly from the values produced by any mathematical model. Dollars are in millions.
Hypothetical change in volatility (percentage points) Hypothetical fair value
Increase 2 percentage points .............................................................. $8,950
Increase 4 percentage points .............................................................. 9,407
Decrease 2 percentage points .............................................................. 8,057
Decrease 4 percentage points .............................................................. 7,628
Other Critical Accounting Policies
We record deferred charges with respect to liabilities assumed under retroactive reinsurance contracts. At the inception of
these contracts, the deferred charges represent the difference between the consideration received and the estimated ultimate
liability for unpaid losses. Deferred charges are amortized using the interest method over an estimate of the ultimate claim
payment period with the periodic amortization reflected in earnings as a component of losses and loss adjustment expenses.
Deferred charge balances are adjusted periodically to reflect new projections of the amount and timing of remaining loss
payments. Adjustments to these assumptions are applied retrospectively from the inception of the contract. Unamortized
deferred charges were approximately $4.1 billion at December 31, 2011. Significant changes in the estimated amount and
payment timing of unpaid losses may have a significant effect on unamortized deferred charges and the amount of periodic
amortization.
Our Consolidated Balance Sheet as of December 31, 2011 includes goodwill of acquired businesses of $53.2 billion, which
includes $3.9 billion arising from our acquisition of Lubrizol in September 2011. We evaluate goodwill for impairment at least
annually and conducted our most recent annual review during the fourth quarter of 2011. Such tests include determining the
estimated fair values of our reporting units. There are several methods of estimating a reporting unit’s fair value, including
market quotations, underlying asset and liability fair value determinations and other valuation techniques, such as discounted
88