Berkshire Hathaway 2011 Annual Report Download - page 48
Download and view the complete annual report
Please find page 48 of the 2011 Berkshire Hathaway annual report below. You can navigate through the pages in the report by either clicking on the pages listed below, or by using the keyword search tool below to find specific information within the annual report.
Notes to Consolidated Financial Statements (Continued)
(11) Derivative contracts (Continued)
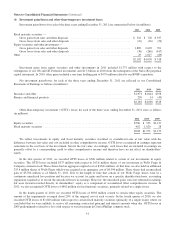
or in net earnings, as appropriate. Derivative contract assets included in other assets of railroad, utilities and energy businesses
were $71 million and $231 million as of December 31, 2011 and December 31, 2010, respectively. Derivative contract liabilities
included in accounts payable, accruals and other liabilities of railroad, utilities and energy businesses were $336 million as of
December 31, 2011 and $621 million as of December 31, 2010.
(12) Supplemental cash flow information
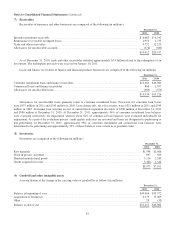
A summary of supplemental cash flow information for each of the three years ending December 31, 2011 is presented in
the following table (in millions).
2011 2010 2009
Cash paid during the period for:
Income taxes ................................................................. $2,885 $ 3,547 $2,032
Interest:
Insurance and other businesses .............................................. 243 185 145
Railroad, utilities and energy businesses ....................................... 1,821 1,667 1,142
Finance and financial products businesses ...................................... 662 708 615
Non-cash investing and financing activities:
Liabilities assumed in connection with acquisitions .................................. 5,836 31,406 278
Common stock issued in connection with acquisition of BNSF ......................... — 10,577 —
Common stock issued in connection with acquisition of noncontrolling interests in Wesco
Financial Corporation ........................................................ 245 — —
(13) Unpaid losses and loss adjustment expenses
The liabilities for unpaid losses and loss adjustment expenses are based upon estimates of the ultimate claim costs
associated with property and casualty claim occurrences as of the balance sheet dates including estimates for incurred but not
reported (“IBNR”) claims. Considerable judgment is required to evaluate claims and establish estimated claim liabilities.
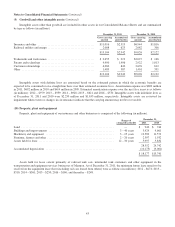
A reconciliation of the changes in liabilities for unpaid losses and loss adjustment expenses of our property/casualty
insurance subsidiaries for each of the three years ending December 31, 2011 is as follows (in millions).
2011 2010 2009
Unpaid losses and loss adjustment expenses:
Gross liabilities at beginning of year .......................................... $60,075 $ 59,416 $ 56,620
Ceded losses and deferred charges at beginning of year ........................... (6,545) (6,879) (7,133)
Net balance at beginning of year ............................................. 53,530 52,537 49,487
Incurred losses recorded during the year:
Current accident year ...................................................... 23,031 20,357 19,156
Prior accident years ....................................................... (2,202) (2,270) (905)
Total incurred losses ...................................................... 20,829 18,087 18,251
Payments during the year with respect to:
Current accident year ...................................................... (9,269) (7,666) (7,207)
Prior accident years ....................................................... (8,854) (9,191) (8,315)
Total payments ........................................................... (18,123) (16,857) (15,522)
Unpaid losses and loss adjustment expenses:
Net balance at end of year .................................................. 56,236 53,767 52,216
Ceded losses and deferred charges at end of year ................................ 7,092 6,545 6,879
Foreign currency translation adjustment ....................................... (100) (312) 232
Acquisitions ............................................................. 591 75 89
Gross liabilities at end of year ................................................... $63,819 $ 60,075 $ 59,416
46


