Berkshire Hathaway 2011 Annual Report Download - page 17
Download and view the complete annual report
Please find page 17 of the 2011 Berkshire Hathaway annual report below. You can navigate through the pages in the report by either clicking on the pages listed below, or by using the keyword search tool below to find specific information within the annual report.-
 1
1 -
2
-
3
-
4
-
5
-
6
-
 7
7 -
 8
8 -
 9
9 -
 10
10 -
 11
11 -
 12
12 -
 13
13 -
 14
14 -
 15
15 -
 16
16 -
 17
17 -
 18
18 -
 19
19 -
 20
20 -
 21
21 -
 22
22 -
 23
23 -
 24
24 -
 25
25 -
 26
26 -
 27
27 -
28
-
29
-
30
-
31
-
32
-
33
-
34
-
35
-
36
-
37
-
38
-
39
-
40
-
41
-
42
-
43
-
44
-
45
-
46
-
47
-
48
-
49
-
50
-
51
-
52
-
53
-
54
-
55
-
56
-
57
-
58
-
59
-
60
-
61
-
62
-
63
-
64
-
65
-
66
-
67
-
68
-
69
-
70
-
71
-
72
-
73
-
74
-
75
-
76
-
77
-
78
-
79
-
80
-
81
-
82
-
83
-
84
-
85
-
86
-
87
-
88
-
89
-
90
-
91
-
92
-
93
-
94
-
95
-
96
-
97
-
98
-
99
-
100
-
101
-
102
-
103
-
104
-
105
 |
 |
The “boys” and I have had many great times together, and I count them among my best friends. The
Blumkins are a remarkable family. Never inclined to let an extraordinary gene pool go to waste, I am
rejoicing these days because several members of the fourth Blumkin generation have joined NFM.
Overall, the intrinsic value of the businesses in this Berkshire sector significantly exceeds their book
value. For many of the smaller companies, however, this is not true. I have made more than my share of mistakes
buying small companies. Charlie long ago told me, “If something’s not worth doing at all, it’s not worth
doing well,” and I should have listened harder. In any event, our large purchases have generally worked
well – extraordinarily well in a few cases – and overall this sector is a winner for us.
************
Certain shareholders have told me they hunger for more discussions of accounting arcana. So here’s a
bit of GAAP-mandated nonsense I hope both of them enjoy.
Common sense would tell you that our varied subsidiaries should be carried on our books at their cost
plus the earnings they have retained since our purchase (unless their economic value has materially decreased, in
which case an appropriate write-down must be taken). And that’s essentially the reality at Berkshire – except for
the weird situation at Marmon.
We purchased 64% of the company in 2008 and put this interest on our books at our cost, $4.8 billion.
So far, so good. Then, in early 2011, pursuant to our original contract with the Pritzker family, we purchased an
additional 16%, paying $1.5 billion as called for by a formula that reflected Marmon’s increased value. In this
instance, however, we were required to immediately write off $614 million of the purchase price retroactive to
the end of 2010. (Don’t ask!) Obviously, this write-off had no connection to economic reality. The excess of
Marmon’s intrinsic value over its carrying value is widened by this meaningless write-down.
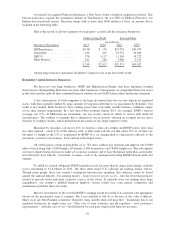
Finance and Financial Products
This sector, our smallest, includes two rental companies, XTRA (trailers) and CORT (furniture), and
Clayton Homes, the country’s leading producer and financer of manufactured homes. Aside from these 100%-owned
subsidiaries, we also include in this category a collection of financial assets and our 50% interest in Berkadia
Commercial Mortgage.
It’s instructive to look at what transpired at our three operating businesses after the economy fell off a
cliff in late 2008, because their experiences illuminate the fractured recovery that later came along.
Results at our two leasing companies mirrored the “non-housing” economy. Their combined pre-tax
earnings were $13 million in 2009, $53 million in 2010 and $155 million in 2011, an improvement reflecting the
steady recovery we have seen in almost all of our non-housing businesses. In contrast, Clayton’s world of
manufactured housing (just like site-built housing) has endured a veritable depression, experiencing no recovery
to date. Manufactured housing sales in the nation were 49,789 homes in 2009, 50,046 in 2010 and 51,606 in
2011. (When housing was booming in 2005, they were 146,744.)
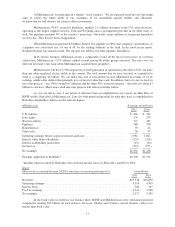
Despite these difficult times, Clayton has continued to operate profitably, largely because its mortgage
portfolio has performed well under trying circumstances. Because we are the largest lender in the manufactured
homes sector and are also normally lending to lower-and-middle-income families, you might expect us to suffer
heavy losses during a housing meltdown. But by sticking to old-fashioned loan policies – meaningful down
payments and monthly payments with a sensible relationship to regular income – Clayton has kept losses to
acceptable levels. It has done so even though many of our borrowers have had negative equity for some time.
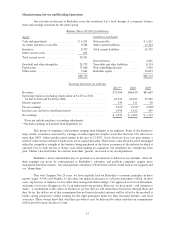
As is well-known, the U.S. went off the rails in its home-ownership and mortgage-lending policies,
and for these mistakes our economy is now paying a huge price. All of us participated in the destructive
behavior – government, lenders, borrowers, the media, rating agencies, you name it. At the core of the folly was
the almost universal belief that the value of houses was certain to increase over time and that any dips
would be inconsequential. The acceptance of this premise justified almost any price and practice in housing
transactions. Homeowners everywhere felt richer and rushed to “monetize” the increased value of their homes by
refinancings. These massive cash infusions fueled a consumption binge throughout our economy. It all seemed
great fun while it lasted. (A largely unnoted fact: Large numbers of people who have “lost” their house through
foreclosure have actually realized a profit because they carried out refinancings earlier that gave them cash in
excess of their cost. In these cases, the evicted homeowner was the winner, and the victim was the lender.)
15