Berkshire Hathaway 2011 Annual Report Download - page 71
Download and view the complete annual report
Please find page 71 of the 2011 Berkshire Hathaway annual report below. You can navigate through the pages in the report by either clicking on the pages listed below, or by using the keyword search tool below to find specific information within the annual report.-
 1
1 -
2
-
3
-
4
-
5
-
6
-
7
-
8
-
9
-
10
-
11
-
12
-
13
-
14
-
15
-
16
-
17
-
18
-
19
-
20
-
21
-
22
-
23
-
24
-
25
-
26
-
27
-
28
-
29
-
30
-
31
-
32
-
33
-
34
-
35
-
36
-
37
-
38
-
39
-
40
-
41
-
42
-
43
-
44
-
45
-
46
-
47
-
48
-
49
-
50
-
51
-
52
-
53
-
54
-
55
-
56
-
57
-
58
-
59
-
60
-
 61
61 -
 62
62 -
 63
63 -
 64
64 -
 65
65 -
 66
66 -
 67
67 -
 68
68 -
 69
69 -
 70
70 -
 71
71 -
 72
72 -
 73
73 -
 74
74 -
 75
75 -
 76
76 -
 77
77 -
 78
78 -
 79
79 -
 80
80 -
 81
81 -
82
-
83
-
84
-
85
-
86
-
87
-
88
-
89
-
90
-
91
-
92
-
93
-
94
-
95
-
96
-
97
-
98
-
99
-
100
-
101
-
102
-
103
-
104
-
105
 |
 |

Management’s Discussion (Continued)
Insurance—Investment Income (Continued)
including: (1) the Swiss Re 12% capital instrument (CHF 3 billion); (2) the Goldman Sachs 10% Preferred Stock ($4.36 billion
of the $5 billion aggregate Preferred Stock was held by insurance subsidiaries); and (3) the General Electric 10% Preferred
Stock ($3 billion). Our insurance subsidiaries earned dividends from these three investments of $420 million in 2011 compared
with approximately $1.0 billion in both 2010 and 2009. Our investment income in the future will be negatively affected by these
redemptions, given the comparatively lower yields currently available from new investment opportunities. In 2011, investment
income was favorably impacted by increased dividend rates with respect to several of our common stock holdings.
Pre-tax investment income in 2010 declined $314 million (5.8%) compared with 2009. The decline in 2010 investment
income reflected lower dividends earned from our investments in Wells Fargo common stock and the impact of a realized gain
in 2009 of approximately $100 million from a short-term currency transaction made in anticipation of our investment in the
Swiss Re capital instrument.
Investment income in 2010 and 2009 included earnings from equity method investments. As a result of a reduction in our
ownership of Moody’s in July of 2009, we discontinued the use of the equity method as of the beginning of the third quarter of
2009. As a result of our acquisition of the remaining outstanding stock of BNSF on February 12, 2010, we discontinued the use
of the equity method and since that date, BNSF’s accounts have been consolidated in our financial statements. Dividends
received on equity method investments are not reflected in our earnings.
Invested assets derive from shareholder capital and reinvested earnings as well as net liabilities under insurance contracts
or “float.” The major components of float are unpaid losses, life, annuity and health benefit liabilities, unearned premiums and
other liabilities to policyholders less premium and reinsurance receivables, deferred charges assumed under retroactive
reinsurance contracts and deferred policy acquisition costs. Float approximated $70 billion at December 31, 2011, $66 billion at
December 31, 2010 and $63 billion at December 31, 2009. The cost of float, as represented by the ratio of underwriting gain or
loss to average float, was negative for the last three years, as our insurance business generated underwriting gains in each year.
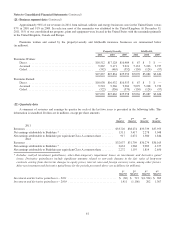
A summary of cash and investments held in our insurance businesses as of December 31, 2011 and 2010 follows. Other
investments include investments in Wrigley, Goldman Sachs, General Electric, Dow Chemical and Bank of America (See Note
5 to the Consolidated Financial Statements). Amounts are in millions.
December 31,
2011 2010
Cash and cash equivalents ............................................................... $ 21,571 $ 24,818
Equity securities ...................................................................... 75,759 59,517
Fixed maturity securities ................................................................ 29,899 32,889
Other ............................................................................... 13,111 19,133
$140,340 $136,357
Fixed maturity investments as of December 31, 2011 were as follows. Amounts are in millions.
Amortized
cost
Unrealized
gains/losses
Fair
value
U.S. Treasury, U.S. government corporations and agencies ............................ $ 2,894 $ 41 $ 2,935
States, municipalities and political subdivisions ..................................... 2,862 208 3,070
Foreign governments .......................................................... 9,467 235 9,702
Corporate bonds, investment grade ............................................... 5,075 603 5,678
Corporate bonds, non-investment grade ........................................... 5,349 682 6,031
Mortgage-backed securities ..................................................... 2,203 280 2,483
$27,850 $2,049 $29,899
U.S. government obligations are rated AA+ or Aaa by the major rating agencies and approximately 86% of all state,
municipal and political subdivisions, foreign government obligations and mortgage-backed securities were rated AA or higher.
Non-investment grade securities represent securities that are rated below BBB- or Baa3. Foreign government securities include
obligations issued or unconditionally guaranteed by national or provincial government entities.
69