Berkshire Hathaway 2011 Annual Report Download - page 4
Download and view the complete annual report
Please find page 4 of the 2011 Berkshire Hathaway annual report below. You can navigate through the pages in the report by either clicking on the pages listed below, or by using the keyword search tool below to find specific information within the annual report.-
 1
1 -
 2
2 -
 3
3 -
 4
4 -
 5
5 -
 6
6 -
 7
7 -
 8
8 -
 9
9 -
 10
10 -
 11
11 -
 12
12 -
 13
13 -
 14
14 -
 15
15 -
16
-
17
-
18
-
19
-
20
-
21
-
22
-
23
-
24
-
25
-
26
-
27
-
28
-
29
-
30
-
31
-
32
-
33
-
34
-
35
-
36
-
37
-
38
-
39
-
40
-
41
-
42
-
43
-
44
-
45
-
46
-
47
-
48
-
49
-
50
-
51
-
52
-
53
-
54
-
55
-
56
-
57
-
58
-
59
-
60
-
61
-
62
-
63
-
64
-
65
-
66
-
67
-
68
-
69
-
70
-
71
-
72
-
73
-
74
-
75
-
76
-
77
-
78
-
79
-
80
-
81
-
82
-
83
-
84
-
85
-
86
-
87
-
88
-
89
-
90
-
91
-
92
-
93
-
94
-
95
-
96
-
97
-
98
-
99
-
100
-
101
-
102
-
103
-
104
-
105
 |
 |

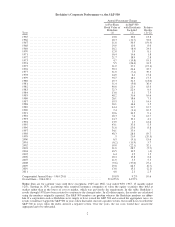
Berkshire’s Corporate Performance vs. the S&P 500
Annual Percentage Change
Year
in Per-Share
Book Value of
Berkshire
(1)
in S&P 500
with Dividends
Included
(2)
Relative
Results
(1)-(2)
1965 ..................................................... 23.8 10.0 13.8
1966 ..................................................... 20.3 (11.7) 32.0
1967 ..................................................... 11.0 30.9 (19.9)
1968 ..................................................... 19.0 11.0 8.0
1969 ..................................................... 16.2 (8.4) 24.6
1970 ..................................................... 12.0 3.9 8.1
1971 ..................................................... 16.4 14.6 1.8
1972 ..................................................... 21.7 18.9 2.8
1973 ..................................................... 4.7 (14.8) 19.5
1974 ..................................................... 5.5 (26.4) 31.9
1975 ..................................................... 21.9 37.2 (15.3)
1976 ..................................................... 59.3 23.6 35.7
1977 ..................................................... 31.9 (7.4) 39.3
1978 ..................................................... 24.0 6.4 17.6
1979 ..................................................... 35.7 18.2 17.5
1980 ..................................................... 19.3 32.3 (13.0)
1981 ..................................................... 31.4 (5.0) 36.4
1982 ..................................................... 40.0 21.4 18.6
1983 ..................................................... 32.3 22.4 9.9
1984 ..................................................... 13.6 6.1 7.5
1985 ..................................................... 48.2 31.6 16.6
1986 ..................................................... 26.1 18.6 7.5
1987 ..................................................... 19.5 5.1 14.4
1988 ..................................................... 20.1 16.6 3.5
1989 ..................................................... 44.4 31.7 12.7
1990 ..................................................... 7.4 (3.1) 10.5
1991 ..................................................... 39.6 30.5 9.1
1992 ..................................................... 20.3 7.6 12.7
1993 ..................................................... 14.3 10.1 4.2
1994 ..................................................... 13.9 1.3 12.6
1995 ..................................................... 43.1 37.6 5.5
1996 ..................................................... 31.8 23.0 8.8
1997 ..................................................... 34.1 33.4 .7
1998 ..................................................... 48.3 28.6 19.7
1999 ..................................................... .5 21.0 (20.5)
2000 ..................................................... 6.5 (9.1) 15.6
2001 ..................................................... (6.2) (11.9) 5.7
2002 ..................................................... 10.0 (22.1) 32.1
2003 ..................................................... 21.0 28.7 (7.7)
2004 ..................................................... 10.5 10.9 (.4)
2005 ..................................................... 6.4 4.9 1.5
2006 ..................................................... 18.4 15.8 2.6
2007 ..................................................... 11.0 5.5 5.5
2008 ..................................................... (9.6) (37.0) 27.4
2009 ..................................................... 19.8 26.5 (6.7)
2010 ..................................................... 13.0 15.1 (2.1)
2011 ..................................................... 4.6 2.1 2.5
Compounded Annual Gain – 1965-2011 ......................... 19.8% 9.2% 10.6
Overall Gain – 1964-2011 .................................... 513,055% 6,397%
Notes: Data are for calendar years with these exceptions: 1965 and 1966, year ended 9/30; 1967, 15 months ended
12/31. Starting in 1979, accounting rules required insurance companies to value the equity securities they hold at
market rather than at the lower of cost or market, which was previously the requirement. In this table, Berkshire’s
results through 1978 have been restated to conform to the changed rules. In all other respects, the results are calculated
using the numbers originally reported. The S&P 500 numbers are pre-tax whereas the Berkshire numbers are after-
tax. If a corporation such as Berkshire were simply to have owned the S&P 500 and accrued the appropriate taxes, its
results would have lagged the S&P 500 in years when that index showed a positive return, but would have exceeded the
S&P 500 in years when the index showed a negative return. Over the years, the tax costs would have caused the
aggregate lag to be substantial.
2