Berkshire Hathaway 2011 Annual Report Download - page 75
Download and view the complete annual report
Please find page 75 of the 2011 Berkshire Hathaway annual report below. You can navigate through the pages in the report by either clicking on the pages listed below, or by using the keyword search tool below to find specific information within the annual report.-
 1
1 -
2
-
3
-
4
-
5
-
6
-
7
-
8
-
9
-
10
-
11
-
12
-
13
-
14
-
15
-
16
-
17
-
18
-
19
-
20
-
21
-
22
-
23
-
24
-
25
-
26
-
27
-
28
-
29
-
30
-
31
-
32
-
33
-
34
-
35
-
36
-
37
-
38
-
39
-
40
-
41
-
42
-
43
-
44
-
45
-
46
-
47
-
48
-
49
-
50
-
51
-
52
-
53
-
54
-
55
-
56
-
57
-
58
-
59
-
60
-
61
-
62
-
63
-
64
-
 65
65 -
 66
66 -
 67
67 -
 68
68 -
 69
69 -
 70
70 -
 71
71 -
 72
72 -
 73
73 -
 74
74 -
 75
75 -
 76
76 -
 77
77 -
 78
78 -
 79
79 -
 80
80 -
 81
81 -
 82
82 -
 83
83 -
 84
84 -
 85
85 -
86
-
87
-
88
-
89
-
90
-
91
-
92
-
93
-
94
-
95
-
96
-
97
-
98
-
99
-
100
-
101
-
102
-
103
-
104
-
105
 |
 |
Management’s Discussion (Continued)
Manufacturing, Service and Retailing (Continued)
Marmon (Continued)
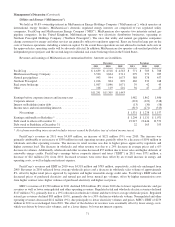
Marmon’s revenues in 2010 were $6.0 billion, an increase of approximately 18% over 2009. About 40% of the aggregate
revenue increase was the result of increased copper prices in the Building Wire and Flow Products sectors. The balance of the
revenue increase in 2010 was associated with a gradual rebound in the other sectors, as Marmon’s end markets improved from
the low levels in 2009. Pre-tax earnings in 2010 of $813 million increased 19% over 2009. With the exception of Distribution
Services, all sectors had improvements in pre-tax earnings in 2010. Pre-tax earnings as a percent of revenues were 13.6% in
2010 and 13.5% in 2009. The pre-tax earnings to revenues percentage in 2010 was negatively impacted by the increase in
copper prices, as the increased cost is passed on to customers with little or no additional margin. The Transportation Services &
Engineered Products and the Building Wire sectors had the largest dollar increases in pre-tax earnings in 2010 compared to
2009.
McLane Company
Through McLane, we operate a wholesale distribution business that provides grocery and non-food products to retailers,
convenience stores and restaurants. McLane’s business is marked by high sales volume and very low profit margins. McLane’s
significant customers include Wal-Mart, 7-Eleven and Yum! Brands. Approximately 30% of McLane’s annual revenues are
attributable to Wal-Mart. A curtailment of purchasing by Wal-Mart or another of its significant customers could have a material
adverse impact on McLane’s periodic revenues and earnings. In 2010, McLane acquired Empire Distributors, based in Georgia
and North Carolina, and Horizon Wine and Spirits Inc., based in Tennessee. Empire and Horizon are wholesale distributors of
distilled spirits, wine and beer.
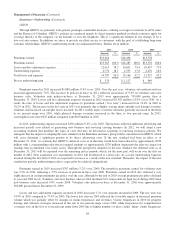
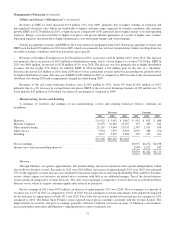
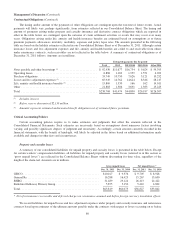
McLane’s revenues of $33.3 billion in 2011 increased approximately $600 million (2%) over 2010. The increase in
revenues in 2011 was partially attributable to the inclusion of the full-year results of Empire and Horizon. Otherwise, revenues
in 2011 from the grocery business were relatively unchanged from 2010, while revenues from the foodservice business
increased approximately 7% over 2010. Pre-tax earnings in 2011 were essentially unchanged from 2010 which reflected the
inclusion of Empire and Horizon and increased earnings from the grocery business, offset by lower earnings from the
foodservice business. In 2011, McLane benefitted from a slight increase in its consolidated gross sales margin, which was offset
by increased fuel, trucking and legal and professional costs.
McLane’s revenues in 2010 were $32.7 billion, representing an increase of $1.5 billion (5%) over 2009 reflecting an 11%
increase in foodservice revenues (driven by increased unit volume) and a relatively minor increase in grocery revenues. Pre-tax
earnings in 2010 of $369 million increased $25 million (7%) over 2009. The increase in earnings in 2010 reflected the favorable
impact of the Empire acquisition and increased foodservice earnings, partially offset by lower earnings from the grocery
division. The combined gross margin rate in 2010 was 5.75% versus 5.72% in 2009. Earnings in 2009 included the impact of a
substantial inventory price change gain in the grocery division associated with an increase in federal excise taxes on cigarettes.
Many tobacco manufacturers raised prices in anticipation of the tax increase, which allowed McLane to generate a one-time
price change gain.
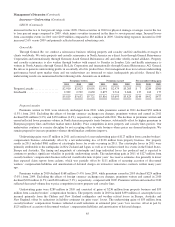
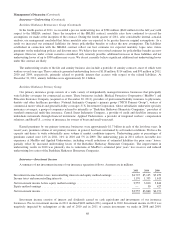
Other manufacturing
Our other manufacturing businesses include several manufacturers of building products (Acme Building Brands, Benjamin
Moore, Johns Manville, Shaw and MiTek) and apparel (led by Fruit of the Loom which includes the Russell athletic apparel and
sporting goods business and the Vanity Fair Brands women’s intimate apparel business). Also included in this group are Forest
River, a leading manufacturer of leisure vehicles, IMC Metalworking Companies (“Iscar”), an industry leader in the metal
cutting tools business with operations worldwide and CTB, a manufacturer of equipment and systems for the livestock and
agricultural industries. Other manufacturing businesses also include The Lubrizol Corporation (“Lubrizol”), a specialty
chemical manufacturer, beginning as of September 16, 2011. In 2011, our other manufacturing businesses generally experienced
increased levels of business and improved operating results, although the rates of improvement have been uneven.
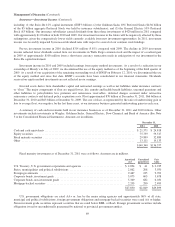
Other manufacturing revenues increased $3.5 billion (20%) in 2011 to $21.2 billion compared with 2010. In 2011, Lubrizol
accounted for approximately $1.7 billion of the increase. Otherwise, revenues of our other manufacturing group increased 10%.
Iscar and CTB in particular experienced strong demand for their products.
Pre-tax earnings of our other manufacturing businesses were $2.4 billion in 2011, an increase of $486 million (25%) over
2010. Excluding the impact of Lubrizol, earnings increased 10% compared to 2010. Increased earnings were generated by Iscar
73