Berkshire Hathaway 2011 Annual Report Download - page 53
Download and view the complete annual report
Please find page 53 of the 2011 Berkshire Hathaway annual report below. You can navigate through the pages in the report by either clicking on the pages listed below, or by using the keyword search tool below to find specific information within the annual report.-
 1
1 -
2
-
3
-
4
-
5
-
6
-
7
-
8
-
9
-
10
-
11
-
12
-
13
-
14
-
15
-
16
-
17
-
18
-
19
-
20
-
21
-
22
-
23
-
24
-
25
-
26
-
27
-
28
-
29
-
30
-
31
-
32
-
33
-
34
-
35
-
36
-
37
-
38
-
39
-
40
-
41
-
42
-
 43
43 -
 44
44 -
 45
45 -
 46
46 -
 47
47 -
 48
48 -
 49
49 -
 50
50 -
 51
51 -
 52
52 -
 53
53 -
 54
54 -
 55
55 -
 56
56 -
 57
57 -
 58
58 -
 59
59 -
 60
60 -
 61
61 -
 62
62 -
 63
63 -
64
-
65
-
66
-
67
-
68
-
69
-
70
-
71
-
72
-
73
-
74
-
75
-
76
-
77
-
78
-
79
-
80
-
81
-
82
-
83
-
84
-
85
-
86
-
87
-
88
-
89
-
90
-
91
-
92
-
93
-
94
-
95
-
96
-
97
-
98
-
99
-
100
-
101
-
102
-
103
-
104
-
105
 |
 |

Notes to Consolidated Financial Statements (Continued)
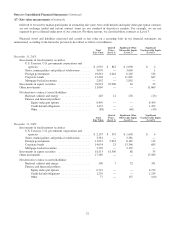
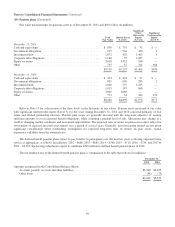
(17) Fair value measurements
The estimated fair values of our financial instruments are shown in the following table (in millions). The carrying values of
cash and cash equivalents, accounts receivable and accounts payable, accruals and other liabilities are deemed to be reasonable
estimates of their fair values.
Carrying Value Fair Value
December 31, December 31,
2011 2010 2011 2010
Investments in fixed maturity securities .......................... $32,188 $34,883 $32,188 $34,883
Investments in equity securities ................................ 76,991 61,513 76,991 61,513
Other investments ........................................... 16,921 23,009 17,927 24,147
Loans and finance receivables .................................. 13,934 15,226 13,126 14,453
Derivative contract assets (1) ................................... 327 574 327 574
Notes payable and other borrowings:
Insurance and other ...................................... 13,768 12,471 14,334 12,705
Railroad, utilities and energy ............................... 32,580 31,626 38,257 33,932
Finance and financial products ............................. 14,036 14,477 14,959 15,191
Derivative contract liabilities:
Railroad, utilities and energy (2) ............................. 336 621 336 621
Finance and financial products ............................. 10,139 8,371 10,139 8,371
(1)Included in other assets
(2) Included in accounts payable, accruals and other liabilities
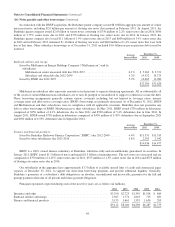
Fair values for substantially all of our financial instruments were measured using market or income approaches.
Considerable judgment may be required in interpreting market data used to develop the estimates of fair value. Accordingly, the
estimates presented herein are not necessarily indicative of the amounts that could be realized in an actual current market
exchange. The use of different market assumptions and/or estimation methodologies may have a material effect on the estimated
fair value.
The hierarchy for measuring fair value consists of Levels 1 through 3.
Level 1 – Inputs represent unadjusted quoted prices for identical assets or liabilities exchanged in active markets.
Substantially all of our investments in equity securities are traded on an exchange in active markets and fair values are
based on the closing prices as of the balance sheet date.
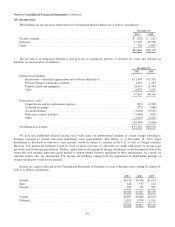
Level 2 – Inputs include directly or indirectly observable inputs (other than Level 1 inputs) such as quoted prices for
similar assets or liabilities exchanged in active or inactive markets; quoted prices for identical assets or liabilities
exchanged in inactive markets; other inputs that may be considered in fair value determinations of the assets or liabilities,
such as interest rates and yield curves, volatilities, prepayment speeds, loss severities, credit risks and default rates; and
inputs that are derived principally from or corroborated by observable market data by correlation or other means. Fair
values for our investments in fixed maturity securities are primarily based on price evaluations which incorporate market
prices for identical instruments in inactive markets and market data available for instruments with similar characteristics.
Pricing evaluations generally reflect discounted expected future cash flows, which incorporate yield curves for instruments
with similar characteristics, such as credit rating, estimated duration and yields for other instruments of the issuer or
entities in the same industry sector.
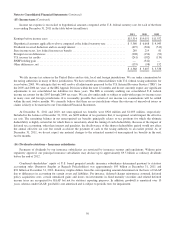
Level 3 – Inputs include unobservable inputs used in the measurement of assets and liabilities. Management is required to
use its own assumptions regarding unobservable inputs because there is little, if any, market activity in the assets or
liabilities or related observable inputs that can be corroborated at the measurement date. Unobservable inputs require
management to make certain projections and assumptions about the information that would be used by market participants
in pricing assets or liabilities. Measurements of non-exchange traded derivative contracts and certain other investments
carried at fair value are based primarily on valuation models, discounted cash flow models or other valuation techniques
that are believed to be used by market participants. We value equity index put option contracts based on the Black-Scholes
option valuation model which we believe is widely used by market participants. Inputs to this model include current index
price, expected volatility, dividend and interest rates and contract duration. Our credit default contracts are primarily
valued based on models that incorporate observable credit default spreads, contract durations, interest rates and other inputs
51