Berkshire Hathaway 2011 Annual Report Download - page 43
Download and view the complete annual report
Please find page 43 of the 2011 Berkshire Hathaway annual report below. You can navigate through the pages in the report by either clicking on the pages listed below, or by using the keyword search tool below to find specific information within the annual report.-
 1
1 -
2
-
3
-
4
-
5
-
6
-
7
-
8
-
9
-
10
-
11
-
12
-
13
-
14
-
15
-
16
-
17
-
18
-
19
-
20
-
21
-
22
-
23
-
24
-
25
-
26
-
27
-
28
-
29
-
30
-
31
-
32
-
 33
33 -
 34
34 -
 35
35 -
 36
36 -
 37
37 -
 38
38 -
 39
39 -
 40
40 -
 41
41 -
 42
42 -
 43
43 -
 44
44 -
 45
45 -
 46
46 -
 47
47 -
 48
48 -
 49
49 -
 50
50 -
 51
51 -
 52
52 -
 53
53 -
54
-
55
-
56
-
57
-
58
-
59
-
60
-
61
-
62
-
63
-
64
-
65
-
66
-
67
-
68
-
69
-
70
-
71
-
72
-
73
-
74
-
75
-
76
-
77
-
78
-
79
-
80
-
81
-
82
-
83
-
84
-
85
-
86
-
87
-
88
-
89
-
90
-
91
-
92
-
93
-
94
-
95
-
96
-
97
-
98
-
99
-
100
-
101
-
102
-
103
-
104
-
105
 |
 |

Notes to Consolidated Financial Statements (Continued)
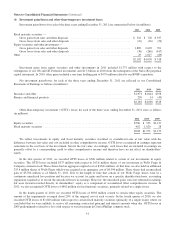
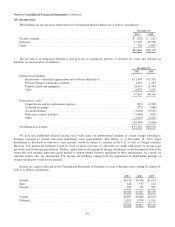
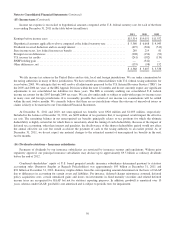
(6) Investment gains/losses and other-than-temporary investment losses
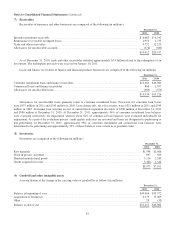
Investment gains/losses for each of the three years ending December 31, 2011 are summarized below (in millions).
2011 2010 2009
Fixed maturity securities —
Gross gains from sales and other disposals ........................................... $ 310 $ 720 $357
Gross losses from sales and other disposals .......................................... (10) (16) (54)
Equity securities and other investments —
Gross gains from sales and other disposals ........................................... 1,889 2,603 701
Gross losses from sales and other disposals .......................................... (36) (266) (617)
Other ............................................................................ 29 1,017 (69)
$2,182 $4,058 $ 318
Investment gains from equity securities and other investments in 2011 included $1,775 million with respect to the
redemptions of our GS and GE Preferred investments and $1.3 billion in 2010 from the redemption of the Swiss Re perpetual
capital instrument. In 2010, other gains included a one-time holding gain of $979 million related to our BNSF acquisition.
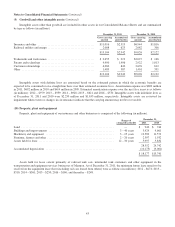
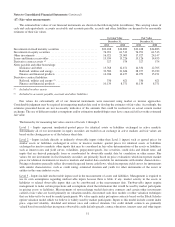
Net investment gains/losses for each of the three years ending December 31, 2011 are reflected in our Consolidated
Statements of Earnings as follows (in millions).
2011 2010 2009
Insurance and other .................................................................. $1,973 $4,044 $358
Finance and financial products ......................................................... 209 14 (40)
$2,182 $4,058 $318
Other-than-temporary investment (“OTTI”) losses for each of the three years ending December 31, 2011 were as follows
(in millions).
2011 2010 2009
Equity securities .................................................................... $506 $ 953 $3,127
Fixed maturity securities .............................................................. 402 1,020 28
$908 $1,973 $3,155
We reflect investments in equity and fixed maturity securities classified as available-for-sale at fair value with the
difference between fair value and cost included in other comprehensive income. OTTI losses recognized in earnings represent
reductions in the cost basis of the investment, but not the fair value. Accordingly, such losses that are included in earnings are
generally offset by a corresponding credit to other comprehensive income and therefore have no net effect on shareholders’
equity.
In the first quarter of 2011, we recorded OTTI losses of $506 million related to certain of our investments in equity
securities. The OTTI losses included $337 million with respect to 103.6 million shares of our investment in Wells Fargo &
Company common stock. These shares had an aggregate original cost of $3,621 million. At that time, we also held an additional
255.4 million shares of Wells Fargo which were acquired at an aggregate cost of $4,394 million. These shares had an unrealized
gain of $3,704 million as of March 31, 2011. Due to the length of time that certain of our Wells Fargo shares were in a
continuous unrealized loss position and because we account for gains and losses on a specific identification basis, accounting
regulations required us to record the unrealized losses in earnings. However, the unrealized gains were not reflected in earnings
but were instead recorded directly in shareholders’ equity as a component of accumulated other comprehensive income. In
2011, we also recognized OTTI losses of $402 million on fixed maturity securities, primarily related to a single issuer.
In the fourth quarter of 2010, we recorded OTTI losses of $938 million related to certain other equity securities. The
amount of the impairments averaged about 20% of the original cost of each security. In the fourth quarter of 2010, we also
recorded OTTI losses of $1,020 million with respect to certain fixed maturity securities (primarily of a single issuer) where we
concluded that we were unlikely to receive all remaining contractual principal and interest amounts when due. OTTI losses in
2009 predominantly related to a loss with respect to our investment in ConocoPhillips common stock.
41