Berkshire Hathaway 2011 Annual Report Download - page 78
Download and view the complete annual report
Please find page 78 of the 2011 Berkshire Hathaway annual report below. You can navigate through the pages in the report by either clicking on the pages listed below, or by using the keyword search tool below to find specific information within the annual report.-
 1
1 -
2
-
3
-
4
-
5
-
6
-
7
-
8
-
9
-
10
-
11
-
12
-
13
-
14
-
15
-
16
-
17
-
18
-
19
-
20
-
21
-
22
-
23
-
24
-
25
-
26
-
27
-
28
-
29
-
30
-
31
-
32
-
33
-
34
-
35
-
36
-
37
-
38
-
39
-
40
-
41
-
42
-
43
-
44
-
45
-
46
-
47
-
48
-
49
-
50
-
51
-
52
-
53
-
54
-
55
-
56
-
57
-
58
-
59
-
60
-
61
-
62
-
63
-
64
-
65
-
66
-
67
-
 68
68 -
 69
69 -
 70
70 -
 71
71 -
 72
72 -
 73
73 -
 74
74 -
 75
75 -
 76
76 -
 77
77 -
 78
78 -
 79
79 -
 80
80 -
 81
81 -
 82
82 -
 83
83 -
 84
84 -
 85
85 -
 86
86 -
 87
87 -
 88
88 -
89
-
90
-
91
-
92
-
93
-
94
-
95
-
96
-
97
-
98
-
99
-
100
-
101
-
102
-
103
-
104
-
105
 |
 |

Management’s Discussion (Continued)
Finance and Financial Products (Continued)
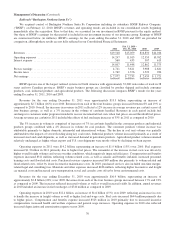
Revenues of CORT and XTRA increased $79 million in 2011 compared to 2010, while earnings increased $102 million.
The increases in revenues and earnings were primarily attributable to an increased proportion of assets on lease (utilization
rates) and lower depreciation expense. A significant portion of the expense structures of our leasing businesses, such as
depreciation and facilities expenses, do not change significantly with rental volume, so the impact of revenue changes can have
a disproportionate impact on earnings.
In 2010, revenues from CORT and XTRA were essentially unchanged from 2009. Pre-tax earnings were $53 million, an
increase of $39 million. The earnings increase was primarily attributable to cost containment efforts as well as improved
transportation equipment utilization.
Earnings from our other finance business activities in each of the past three years included investment income from a
portfolio of fixed maturity and equity investments and from a small portfolio of long-held commercial real estate loans. In
addition, other earnings include income from interest rate spreads representing the difference between interest rates charged to
Clayton Homes on borrowings (approximately $11.5 billion as of December 31, 2011), which are used in connection with its
lending activities and interest paid by a Berkshire financing subsidiary to fund the loans to Clayton. A corresponding charge is
reflected in Clayton Homes’ earnings. In addition, other finance business activity includes guaranty fee income of $41 million in
2011 and $38 million in 2010 received from NetJets. NetJets has recorded corresponding charges to its earnings.
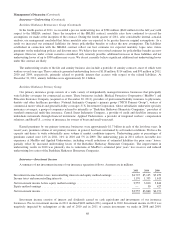
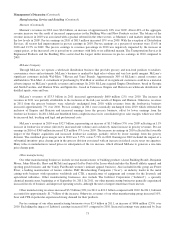
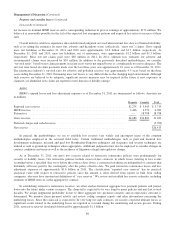
Investment and Derivative Gains/Losses
A summary of investment and derivative gains and losses and other-than-temporary impairment losses on investments
follows. Amounts are in millions.
2011 2010 2009
Investment gains/losses
Sales and other disposals of investments
Insurance and other ...................................................... $1,991 $ 3,032 $ 277
Finance and financial products .............................................. 162 9 110
Other-than-temporary impairment losses on investments ............................. (908) (1,973) (3,155)
Other ...................................................................... 29 1,017 (69)
1,274 2,085 (2,837)
Derivative gains/losses
Credit default contracts ....................................................... (251) 250 789
Equity index put option contracts ............................................... (1,787) 172 2,713
Other derivative contracts ..................................................... (66) (161) 122
(2,104) 261 3,624
Gains/losses before income taxes and noncontrolling interests ............................. (830) 2,346 787
Income taxes and noncontrolling interests ..................................... (309) 472 301
Net gains/losses ................................................................. $ (521) $ 1,874 $ 486
Investment gains/losses arise from the sale or redemption of investments. The timing of gains or losses from sales or
redemptions can have a material effect on periodic earnings. Investment gains and losses usually have minimal impact on the
periodic changes in our consolidated shareholders’ equity since most of our investments are regularly recorded at fair value in
the Consolidated Balance Sheets with the unrealized gains and losses included in shareholders’ equity as a component of
accumulated other comprehensive income.
We believe the amount of investment gains/losses included in earnings in any given period typically has little analytical or
predictive value. Our decisions to sell securities are not motivated by the impact that the resulting gains or losses will have on
our reported earnings. Although our management does not consider investment gains and losses in a given period as necessarily
meaningful or useful in evaluating periodic earnings, we are providing information to explain the nature of such gains and losses
when they are reflected in earnings.
76