Berkshire Hathaway 2011 Annual Report Download - page 45
Download and view the complete annual report
Please find page 45 of the 2011 Berkshire Hathaway annual report below. You can navigate through the pages in the report by either clicking on the pages listed below, or by using the keyword search tool below to find specific information within the annual report.-
 1
1 -
2
-
3
-
4
-
5
-
6
-
7
-
8
-
9
-
10
-
11
-
12
-
13
-
14
-
15
-
16
-
17
-
18
-
19
-
20
-
21
-
22
-
23
-
24
-
25
-
26
-
27
-
28
-
29
-
30
-
31
-
32
-
33
-
34
-
 35
35 -
 36
36 -
 37
37 -
 38
38 -
 39
39 -
 40
40 -
 41
41 -
 42
42 -
 43
43 -
 44
44 -
 45
45 -
 46
46 -
 47
47 -
 48
48 -
 49
49 -
 50
50 -
 51
51 -
 52
52 -
 53
53 -
 54
54 -
 55
55 -
56
-
57
-
58
-
59
-
60
-
61
-
62
-
63
-
64
-
65
-
66
-
67
-
68
-
69
-
70
-
71
-
72
-
73
-
74
-
75
-
76
-
77
-
78
-
79
-
80
-
81
-
82
-
83
-
84
-
85
-
86
-
87
-
88
-
89
-
90
-
91
-
92
-
93
-
94
-
95
-
96
-
97
-
98
-
99
-
100
-
101
-
102
-
103
-
104
-
105
 |
 |
Notes to Consolidated Financial Statements (Continued)
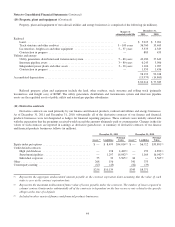
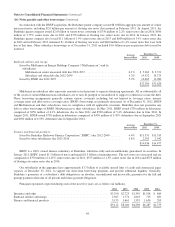
(9) Goodwill and other intangible assets (Continued)
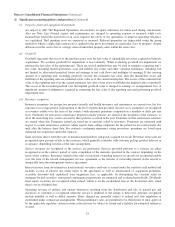
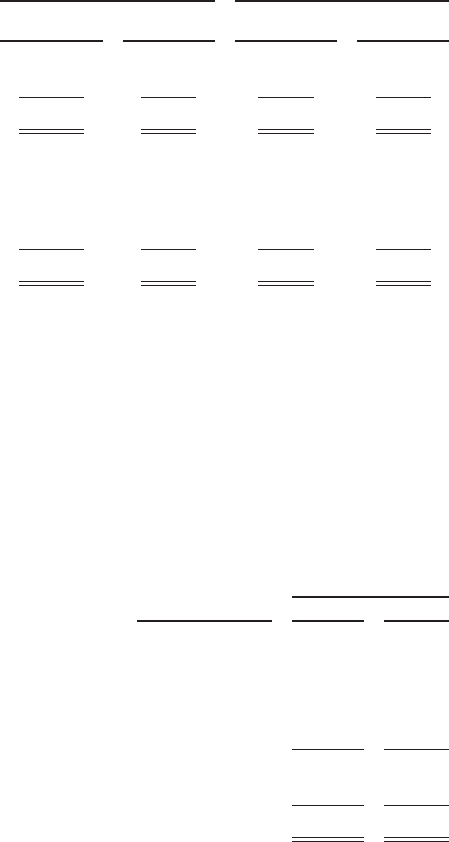
Intangible assets other than goodwill are included in other assets in our Consolidated Balance Sheets and are summarized
by type as follows (in millions).
December 31, 2011 December 31, 2010
Gross carrying
amount
Accumulated
amortization
Gross carrying
amount
Accumulated
amortization
Insurance and other ........................................ $11,016 $2,319 $6,944 $1,816
Railroad, utilities and energy ................................. 2,088 623 2,082 306
$13,104 $2,942 $9,026 $2,122
Trademarks and trade names ................................. $ 2,655 $ 219 $2,027 $ 166
Patents and technology ..................................... 4,900 1,496 2,922 1,013
Customer relationships ..................................... 4,060 840 2,676 612
Other ................................................... 1,489 387 1,401 331
$13,104 $2,942 $9,026 $2,122
Intangible assets with definite lives are amortized based on the estimated pattern in which the economic benefits are
expected to be consumed or on a straight-line basis over their estimated economic lives. Amortization expense was $809 million
in 2011, $692 million in 2010 and $414 million in 2009. Estimated amortization expense over the next five years is as follows
(in millions): 2012 – $979; 2013 – $959; 2014 – $928; 2015 – $621 and 2016 – $570. Intangible assets with indefinite lives as
of December 31, 2011 and 2010 were $2,250 million and $1,635 million, respectively. Intangible assets are reviewed for
impairment when events or changes in circumstances indicate that the carrying amount may not be recoverable.
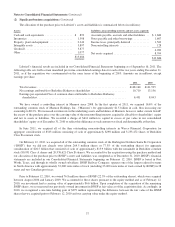
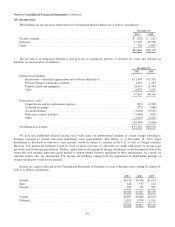
(10) Property, plant and equipment
Property, plant and equipment of our insurance and other businesses is comprised of the following (in millions).
Ranges of
estimated useful life
December 31,
2011 2010
Land ................................................................. — $ 940 $ 744
Buildings and improvements .............................................. 3–40years 5,429 4,661
Machinery and equipment ................................................ 3–25years 13,589 11,573
Furniture, fixtures and other ............................................... 2–20years 2,397 1,932
Assets held for lease ..................................................... 12–30years 5,997 5,832
28,352 24,742
Accumulated depreciation ................................................ (10,175) (9,001)
$ 18,177 $15,741
Assets held for lease consist primarily of railroad tank cars, intermodal tank containers and other equipment in the
transportation and equipment services businesses of Marmon. As of December 31, 2011, the minimum future lease rentals to be
received on the equipment lease fleet (including rail cars leased from others) were as follows (in millions): 2012 – $674; 2013 –
$510; 2014 – $361; 2015 – $250; 2016 – $160; and thereafter – $248.
43