Berkshire Hathaway 2011 Annual Report Download - page 76
Download and view the complete annual report
Please find page 76 of the 2011 Berkshire Hathaway annual report below. You can navigate through the pages in the report by either clicking on the pages listed below, or by using the keyword search tool below to find specific information within the annual report.-
 1
1 -
2
-
3
-
4
-
5
-
6
-
7
-
8
-
9
-
10
-
11
-
12
-
13
-
14
-
15
-
16
-
17
-
18
-
19
-
20
-
21
-
22
-
23
-
24
-
25
-
26
-
27
-
28
-
29
-
30
-
31
-
32
-
33
-
34
-
35
-
36
-
37
-
38
-
39
-
40
-
41
-
42
-
43
-
44
-
45
-
46
-
47
-
48
-
49
-
50
-
51
-
52
-
53
-
54
-
55
-
56
-
57
-
58
-
59
-
60
-
61
-
62
-
63
-
64
-
65
-
 66
66 -
 67
67 -
 68
68 -
 69
69 -
 70
70 -
 71
71 -
 72
72 -
 73
73 -
 74
74 -
 75
75 -
 76
76 -
 77
77 -
 78
78 -
 79
79 -
 80
80 -
 81
81 -
 82
82 -
 83
83 -
 84
84 -
 85
85 -
 86
86 -
87
-
88
-
89
-
90
-
91
-
92
-
93
-
94
-
95
-
96
-
97
-
98
-
99
-
100
-
101
-
102
-
103
-
104
-
105
 |
 |
Management’s Discussion (Continued)
Manufacturing, Service and Retailing (Continued)
Other manufacturing (Continued)
and CTB, which were partially offset by lower earnings of the apparel group and, particularly from the Fruit of the Loom group
of businesses, which were negatively impacted by significantly higher cotton costs. Our building products businesses continue
to be negatively impacted by slow residential housing construction activity. Overall, our manufacturing businesses benefitted in
2011 and 2010 from higher customer demand and ongoing cost containment efforts.
Revenues from our other manufacturing activities were $17.7 billion in 2010, an increase of $1.7 billion (11%) over 2009. The
increase was primarily due to volume driven increases of Forest River, Iscar, CTB and Johns Manville. These operations
rebounded in 2010 from slow business activity in 2009. Pre-tax earnings of our other manufacturing businesses were $1.9 billion in
2010, an increase of $953 million (99%) compared with earnings in 2009. The improvements in earnings were driven by significant
earnings increases at almost all of our manufacturing businesses, including our apparel and building products businesses.
Other service
Our other service businesses include NetJets, the world’s leading provider of fractional ownership programs for general
aviation aircraft and FlightSafety, a provider of high technology training to operators of aircraft. Among the other businesses
included in this group are: TTI, a leading electronic components distributor; Business Wire, a leading distributor of corporate
news, multimedia and regulatory filings; Pampered Chef, a direct seller of high quality kitchen tools; Dairy Queen, which
licenses and services a system of over 6,100 stores that offer prepared dairy treats and food; Buffalo News, a publisher of a daily
and Sunday newspaper; and businesses that provide management and other services to insurance companies. At the end of 2011,
we acquired the Omaha World-Herald Company, a publisher of daily and weekly newpapers in Nebraska and Iowa.
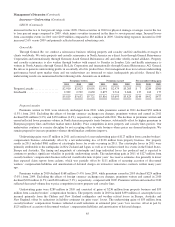
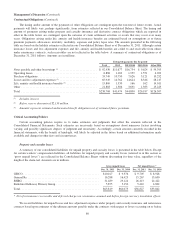
Revenues of our other service businesses were approximately $7.9 billion in 2011, an increase of $579 million (8%) over
2010. The revenue increase was primarily attributable to stronger demand for electronic components (TTI) and pilot training
(FlightSafety) and from higher revenues at NetJets. TTI revenues increased 12% as revenues increased rapidly during the first
half of 2011, and then moderated over the second half. FlightSafety’s revenues increased approximately 8% due primarily to
increases in training demand within the business aviation and regional airline markets, partially offset by lower revenues from
government customers. The comparative revenue increases of NetJets reflected revenues related to aircraft operating cost
increases that are passed through to customers (with little or no margin), and slight increases in rates. Revenue hours flown in
2011 were essentially unchanged from 2010.
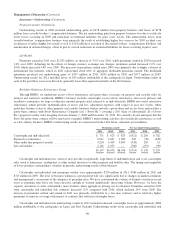
Pre-tax earnings were $1,039 million in 2011, which exceeded 2010 by $55 million (6%). The increase in earnings was
driven by higher earnings of FlightSafety, NetJets and TTI, partially offset by lower earnings from Pampered Chef and Buffalo
News. FlightSafety’s earnings increased approximately 16%, reflecting the increased revenues and ongoing cost containment
efforts. NetJets’ earnings increased 10% and was primarily attributable to higher revenues and lower aircraft maintenance costs
due to a 10% reduction in the size of the fleet, partially offset by comparatively higher impairment charges related to the
planned disposition of certain aircraft and fees incurred to cancel certain aircraft purchase commitments. Since the end of 2008,
NetJets has reduced the number of aircraft in its fleet by approximately 20% and lowered its operating cost structure to better
match customer demand, which we believe will help NetJets continue to operate profitably in the future.
In 2010, revenues of our other service businesses were $7.4 billion, an increase of $770 million (12%) compared to 2009.
Pre-tax earnings in 2010 were $984 million compared to a loss of $91 million in 2009. The improved results were significantly
driven by improved operating results of NetJets and TTI. NetJets generated pre-tax earnings of $207 million in 2010 compared
to a pre-tax loss of $711 million in 2009, which included $676 million of asset writedowns and other downsizing costs. The
asset writedowns were primarily related to excess aircraft that have been subsequently sold or are expected to be sold for cash
consideration approximating their written down values. Such costs were relatively minor in 2010. Revenues of TTI increased by
approximately 45% which was driven by very strong worldwide demand. As a result of the increase in revenues, pre-tax
earnings of TTI were significantly higher.
Retailing
Our retailing operations consist of four home furnishings businesses (Nebraska Furniture Mart, R.C. Willey, Star Furniture
and Jordan’s), three jewelry businesses (Borsheims, Helzberg and Ben Bridge) and See’s Candies. Revenues of these businesses
74