Berkshire Hathaway 2011 Annual Report Download - page 92
Download and view the complete annual report
Please find page 92 of the 2011 Berkshire Hathaway annual report below. You can navigate through the pages in the report by either clicking on the pages listed below, or by using the keyword search tool below to find specific information within the annual report.-
 1
1 -
2
-
3
-
4
-
5
-
6
-
7
-
8
-
9
-
10
-
11
-
12
-
13
-
14
-
15
-
16
-
17
-
18
-
19
-
20
-
21
-
22
-
23
-
24
-
25
-
26
-
27
-
28
-
29
-
30
-
31
-
32
-
33
-
34
-
35
-
36
-
37
-
38
-
39
-
40
-
41
-
42
-
43
-
44
-
45
-
46
-
47
-
48
-
49
-
50
-
51
-
52
-
53
-
54
-
55
-
56
-
57
-
58
-
59
-
60
-
61
-
62
-
63
-
64
-
65
-
66
-
67
-
68
-
69
-
70
-
71
-
72
-
73
-
74
-
75
-
76
-
77
-
78
-
79
-
80
-
81
-
 82
82 -
 83
83 -
 84
84 -
 85
85 -
 86
86 -
 87
87 -
 88
88 -
 89
89 -
 90
90 -
 91
91 -
 92
92 -
 93
93 -
 94
94 -
 95
95 -
 96
96 -
 97
97 -
 98
98 -
 99
99 -
 100
100 -
 101
101 -
 102
102 -
103
-
104
-
105
 |
 |

Management’s Discussion (Continued)
Interest Rate Risk (Continued)
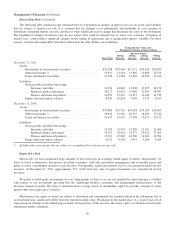
The following table summarizes the estimated effects of hypothetical changes in interest rates on our assets and liabilities
that are subject to interest rate risk. It is assumed that the changes occur immediately and uniformly to each category of
instrument containing interest rate risk, and that no other significant factors change that determine the value of the instrument.
The hypothetical changes in interest rates do not reflect what could be deemed best or worst case scenarios. Variations in
interest rates could produce significant changes in the timing of repayments due to prepayment options available. For these
reasons, actual results might differ from those reflected in the table. Dollars are in millions.
Estimated Fair Value after
Hypothetical Change in Interest Rates
(bp=basis points)
Fair Value
100 bp
decrease
100 bp
increase
200 bp
increase
300 bp
increase
December 31, 2011
Assets:
Investments in fixed maturity securities .................... $32,188 $32,966 $31,371 $30,569 $29,859
Other investments (1) .................................. 13,927 14,501 13,382 12,863 12,374
Loans and finance receivables ........................... 13,126 13,584 12,696 12,292 11,913
Liabilities:
Notes payable and other borrowings:
Insurance and other ................................ 14,334 14,810 13,908 13,525 13,176
Railroad, utilities and energy ........................ 38,257 42,023 35,096 32,403 30,097
Finance and financial products ....................... 14,959 15,541 14,513 14,106 13,732
Equity index put option contracts ......................... 8,499 10,238 7,007 5,733 4,655
December 31, 2010
Assets:
Investments in fixed maturity securities .................... $34,883 $35,710 $34,028 $33,169 $32,405
Other investments (1) .................................. 18,905 19,284 18,535 18,183 17,742
Loans and finance receivables ........................... 14,453 14,937 13,998 13,572 13,172
Liabilities:
Notes payable and other borrowings:
Insurance and other ................................ 12,705 12,995 12,436 12,191 11,964
Railroad, utilities and energy ........................ 33,932 36,924 31,377 29,192 27,303
Finance and financial products ....................... 15,191 15,662 14,760 14,363 13,994
Equity index put option contracts ......................... 6,712 8,358 5,341 4,209 3,284
(1) Includes other investments that are subject to a significant level of interest rate risk.
Equity Price Risk
Historically, we have maintained large amounts of invested assets in exchange traded equity securities. Strategically, we
strive to invest in businesses that possess excellent economics, with able and honest management and at sensible prices and
prefer to invest a meaningful amount in each investee. Consequently, equity investments may be concentrated in relatively few
investees. At December 31, 2011, approximately 57% of the total fair value of equity investments was concentrated in four
investees.
We prefer to hold equity investments for very long periods of time so we are not troubled by short-term price volatility
with respect to our investments provided that the underlying business, economic and management characteristics of the
investees remain favorable. We strive to maintain above average levels of shareholder capital to provide a margin of safety
against short-term equity price volatility.
Market prices for equity securities are subject to fluctuation and consequently the amount realized in the subsequent sale of
an investment may significantly differ from the reported market value. Fluctuation in the market price of a security may result
from perceived changes in the underlying economic characteristics of the investee, the relative price of alternative investments
and general market conditions.
90