Berkshire Hathaway 2011 Annual Report Download - page 70
Download and view the complete annual report
Please find page 70 of the 2011 Berkshire Hathaway annual report below. You can navigate through the pages in the report by either clicking on the pages listed below, or by using the keyword search tool below to find specific information within the annual report.-
 1
1 -
2
-
3
-
4
-
5
-
6
-
7
-
8
-
9
-
10
-
11
-
12
-
13
-
14
-
15
-
16
-
17
-
18
-
19
-
20
-
21
-
22
-
23
-
24
-
25
-
26
-
27
-
28
-
29
-
30
-
31
-
32
-
33
-
34
-
35
-
36
-
37
-
38
-
39
-
40
-
41
-
42
-
43
-
44
-
45
-
46
-
47
-
48
-
49
-
50
-
51
-
52
-
53
-
54
-
55
-
56
-
57
-
58
-
59
-
 60
60 -
 61
61 -
 62
62 -
 63
63 -
 64
64 -
 65
65 -
 66
66 -
 67
67 -
 68
68 -
 69
69 -
 70
70 -
 71
71 -
 72
72 -
 73
73 -
 74
74 -
 75
75 -
 76
76 -
 77
77 -
 78
78 -
 79
79 -
 80
80 -
81
-
82
-
83
-
84
-
85
-
86
-
87
-
88
-
89
-
90
-
91
-
92
-
93
-
94
-
95
-
96
-
97
-
98
-
99
-
100
-
101
-
102
-
103
-
104
-
105
 |
 |

Management’s Discussion (Continued)
Insurance—Underwriting (Continued)
Berkshire Hathaway Reinsurance Group (Continued)
In the fourth quarter of 2011, we recorded a pre-tax underwriting loss of $581 million ($642 million for the full year) with
respect to the SRLHA contract. Since the inception of the SRLHA contract, mortality rates have continued to exceed the
assumptions we made at the inception of the contract. During the fourth quarter of 2011, after considerable internal actuarial
analysis, our management concluded that future mortality rates are expected to be greater than our original assumptions. As a
result we increased our estimated liabilities for future policyholder benefits to reflect the new assumptions. The liabilities
established in connection with the SRLHA contract reflect our best estimates for expected mortality, lapse rates, future
premiums on the underlying policies and discount rates. We believe that our revised estimates for policyholder benefits are now
adequate. However, under certain scenarios considered only remotely possible, additional increases in these liabilities and net
underwriting losses of up to $300 million may occur. We do not currently believe significant additional net underwriting losses
under this contract are likely.
The underwriting results of the life and annuity business also include a portfolio of annuity contracts, most of which were
written several years ago. These contracts generated underwriting losses of $118 million, $114 million, and $99 million in 2011,
2010 and 2009, respectively, primarily related to periodic interest that accretes with respect to the related liabilities. At
December 31, 2011, annuity liabilities were approximately $2.1 billion.
Berkshire Hathaway Primary Group
Our primary insurance group consists of a wide variety of independently managed insurance businesses that principally
write liability coverages for commercial accounts. These businesses include: Medical Protective Corporation (“MedPro”) and
Princeton Insurance Company (acquired as of December 30, 2011), providers of professional liability insurance to physicians,
dentists and other healthcare providers; National Indemnity Company’s primary group (“NICO Primary Group”), writers of
commercial motor vehicle and general liability coverages; U.S. Investment Corporation, whose subsidiaries underwrite specialty
insurance coverages; a group of companies referred to internally as “Berkshire Hathaway Homestate Companies,” providers of
standard commercial multi-line insurance; Central States Indemnity Company, a provider of credit and disability insurance to
individuals nationwide through financial institutions; Applied Underwriters, a provider of integrated workers’ compensation
solutions; and BoatU.S., a writer of insurance for owners of boats and small watercraft.
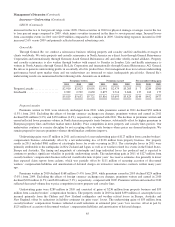
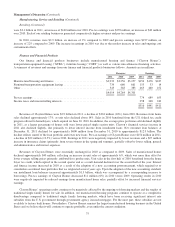
Earned premiums by our primary insurance businesses were approximately $1.7 billion in each of the last three years. In
recent years, premium volume of our primary insurers, in general, has been constrained by soft market conditions. We have the
capacity and desire to write substantially more volume if market conditions improve. Underwriting gains as percentages of
premiums earned were 14% in 2011, 16% in 2010 and 5% in 2009. The underwriting gain in 2011 reflects favorable loss
experience at MedPro and Applied Underwriters, including overall reductions of estimated liabilities for prior years’ losses,
partially offset by increased underwriting losses of the Berkshire Hathaway Homestate Companies. The improvement in
underwriting results in 2010 was primarily due to reductions of MedPro’s estimated prior years’ loss reserves and reduced
underwriting loss ratios of the Berkshire Hathaway Homestate Companies.
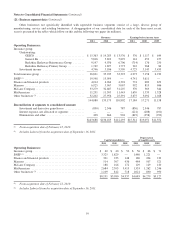
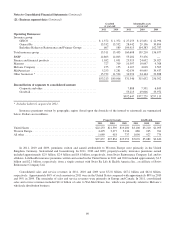
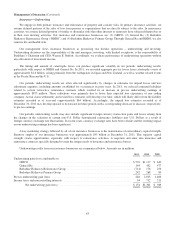
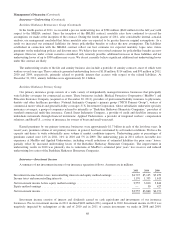
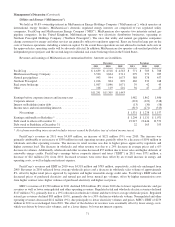
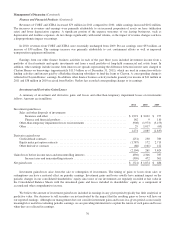
Insurance—Investment Income
A summary of net investment income of our insurance operations follows. Amounts are in millions.
2011 2010 2009
Investment income before taxes, noncontrolling interests and equity method earnings ............ $4,725 $5,145 $5,459
Income taxes and noncontrolling interests ............................................... 1,170 1,335 1,615
Net investment income before equity method earnings ..................................... 3,555 3,810 3,844
Equity method earnings ............................................................. — 50 427
Net investment income .............................................................. $3,555 $3,860 $4,271
Investment income consists of interest and dividends earned on cash equivalents and investments of our insurance
businesses. Pre-tax investment income in 2011 declined $420 million (8%) compared to 2010. Investment income in 2011 was
negatively impacted by redemptions at the end of 2010 and in 2011 of certain investments we made in 2008 and 2009,
68