Berkshire Hathaway 2011 Annual Report Download - page 77
Download and view the complete annual report
Please find page 77 of the 2011 Berkshire Hathaway annual report below. You can navigate through the pages in the report by either clicking on the pages listed below, or by using the keyword search tool below to find specific information within the annual report.-
 1
1 -
2
-
3
-
4
-
5
-
6
-
7
-
8
-
9
-
10
-
11
-
12
-
13
-
14
-
15
-
16
-
17
-
18
-
19
-
20
-
21
-
22
-
23
-
24
-
25
-
26
-
27
-
28
-
29
-
30
-
31
-
32
-
33
-
34
-
35
-
36
-
37
-
38
-
39
-
40
-
41
-
42
-
43
-
44
-
45
-
46
-
47
-
48
-
49
-
50
-
51
-
52
-
53
-
54
-
55
-
56
-
57
-
58
-
59
-
60
-
61
-
62
-
63
-
64
-
65
-
66
-
 67
67 -
 68
68 -
 69
69 -
 70
70 -
 71
71 -
 72
72 -
 73
73 -
 74
74 -
 75
75 -
 76
76 -
 77
77 -
 78
78 -
 79
79 -
 80
80 -
 81
81 -
 82
82 -
 83
83 -
 84
84 -
 85
85 -
 86
86 -
 87
87 -
88
-
89
-
90
-
91
-
92
-
93
-
94
-
95
-
96
-
97
-
98
-
99
-
100
-
101
-
102
-
103
-
104
-
105
 |
 |

Management’s Discussion (Continued)
Manufacturing, Service and Retailing (Continued)
Retailing (Continued)
were $3.1 billion in 2011, an increase of $140 million over 2010. Pre-tax earnings were $239 million, an increase of $42 million
over 2010. Each of our retailing businesses generated comparatively higher revenues and pre-tax earnings.
In 2010, revenues were $2.9 billion, an increase of 2% compared to 2009 and pre-tax earnings were $197 million, an
increase of 22% compared to 2009. The increase in earnings in 2010 was due to the modest increase in sales and ongoing cost
containment efforts.
Finance and Financial Products
Our finance and financial products businesses include manufactured housing and finance (“Clayton Homes”),
transportation equipment leasing (“XTRA”), furniture leasing (“CORT”) as well as various miscellaneous financing activities.
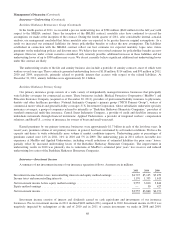
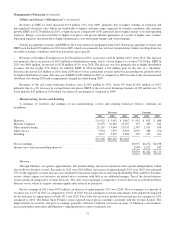
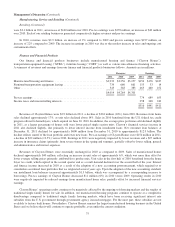
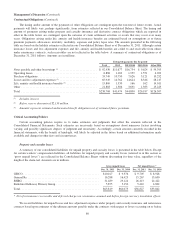
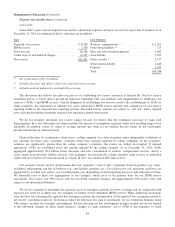
A summary of revenues and earnings from our finance and financial products businesses follows. Amounts are in millions.
Revenues Earnings
2011 2010 2009 2011 2010 2009
Manufactured housing and finance .................................. $2,932 $3,256 $3,257 $154 $176 $187
Furniture/transportation equipment leasing ............................ 739 660 661 155 53 14
Other .......................................................... 343 348 383 465 460 452
$4,014 $4,264 $4,301
Pre-tax earnings ................................................. 774 689 653
Income taxes and noncontrolling interests ............................. 258 248 242
$516 $441 $411
Revenues of Clayton Homes were $2.9 billion in 2011, a decline of $324 million (10%) from 2010. Revenues from home
sales declined approximately 17%, as unit sales declined about 14%. Sales in 2010 benefitted from the U.S. federal tax credit
program offered to homebuyers, which expired on June 30, 2010. In addition, the average price per home sold declined slightly
in 2011, as a larger percentage of homes sold were lower priced single section units. Clayton’s financial services income in
2011 also declined slightly, due primarily to lower interest income from installment loans. Net consumer loan balances at
December 31, 2011 declined by approximately $600 million from December 31, 2010 to approximately $12.9 billion. The
decline reflects runoff of the loan portfolio and fewer new loans. Pre-tax earnings of Clayton Homes were $154 million in 2011,
a decline of $22 million (12.5%) versus 2010. Earnings in 2011 were negatively impacted by lower revenues and a $27 million
increase in insurance claims (primarily from severe storms in the spring and summer), partially offset by lower selling, general
and administrative and interest expenses.
Revenues of Clayton Homes were essentially unchanged in 2010 as compared to 2009. Sales of manufactured homes
declined approximately $40 million, reflecting an increase in unit sales of approximately 6%, which was more than offset by
lower average selling prices primarily attributable to product mix. Unit sales in the first half of 2010 benefitted from the home
buyer tax credit, which expired in the second quarter and as a result demand declined over the second half of the year. Interest
and finance income increased in 2010 as a result of the adoption of a new accounting pronouncement, which required us to
consolidate securitized loan portfolios that we originated several years ago. Upon the adoption of the new accounting standard,
our installment loan balances increased approximately $1.5 billion, which was accompanied by a corresponding increase to
borrowings. Pre-tax earnings of Clayton Homes decreased $11 million (6%) in 2010 versus 2009. Operating results in 2010
were negatively impacted by reduced earnings from manufactured home sales, partially offset by increased financial services
earnings.
Clayton Homes’ operating results continue to be negatively affected by the ongoing soft housing markets and the surplus of
traditional single family homes for sale. In addition, our manufactured housing programs continue to operate at a competitive
disadvantage compared to traditional single family housing markets, which have been receiving significant interest rate
subsidies from the U.S. government through government agency insured mortgages. For the most part, these subsidies are not
available to factory built homes. Nevertheless, Clayton Homes remains the largest manufactured housing business in the United
States and we believe that it will continue to operate profitably, even under the current conditions.
75