Berkshire Hathaway 2011 Annual Report Download - page 72
Download and view the complete annual report
Please find page 72 of the 2011 Berkshire Hathaway annual report below. You can navigate through the pages in the report by either clicking on the pages listed below, or by using the keyword search tool below to find specific information within the annual report.-
 1
1 -
2
-
3
-
4
-
5
-
6
-
7
-
8
-
9
-
10
-
11
-
12
-
13
-
14
-
15
-
16
-
17
-
18
-
19
-
20
-
21
-
22
-
23
-
24
-
25
-
26
-
27
-
28
-
29
-
30
-
31
-
32
-
33
-
34
-
35
-
36
-
37
-
38
-
39
-
40
-
41
-
42
-
43
-
44
-
45
-
46
-
47
-
48
-
49
-
50
-
51
-
52
-
53
-
54
-
55
-
56
-
57
-
58
-
59
-
60
-
61
-
 62
62 -
 63
63 -
 64
64 -
 65
65 -
 66
66 -
 67
67 -
 68
68 -
 69
69 -
 70
70 -
 71
71 -
 72
72 -
 73
73 -
 74
74 -
 75
75 -
 76
76 -
 77
77 -
 78
78 -
 79
79 -
 80
80 -
 81
81 -
 82
82 -
83
-
84
-
85
-
86
-
87
-
88
-
89
-
90
-
91
-
92
-
93
-
94
-
95
-
96
-
97
-
98
-
99
-
100
-
101
-
102
-
103
-
104
-
105
 |
 |

Management’s Discussion (Continued)
Railroad (“Burlington Northern Santa Fe”)
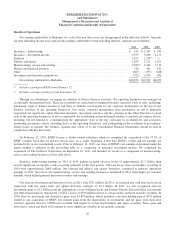
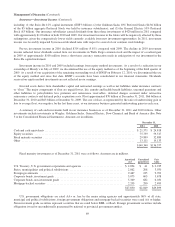
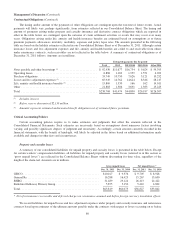
We acquired control of Burlington Northern Santa Fe Corporation including its subsidiary BNSF Railway Company,
(“BNSF”) on February 12, 2010. BNSF’s revenues and operating results are included in our consolidated results beginning
immediately after the acquisition. Prior to that date, we accounted for our investment in BNSF pursuant to the equity method.
Our share of BNSF’s earnings for that period is included in net investment income of our insurance group. Earnings of BNSF
are summarized below (in millions). BNSF’s earnings for the years ending December 31, 2010 and 2009 are provided for
comparison, although these results are not fully reflected in our Consolidated Financial Statements.
2011
Feb. 13, 2010 –
Dec. 31, 2010 2010 2009
Revenues ......................................................... $19,548 $15,059 $16,850 $14,016
Operating expenses ................................................. 14,247 11,013 12,355 10,762
Interest expense .................................................... 560 435 507 613
14,807 11,448 12,862 11,375
Pre-tax earnings .................................................... 4,741 3,611 3,988 2,641
Income taxes ...................................................... 1,769 1,376 1,529 920
Net earnings ....................................................... $ 2,972 $ 2,235 $ 2,459 $ 1,721
BNSF operates one of the largest railroad systems in North America with approximately 32,000 route miles of track in 28
states and two Canadian provinces. BNSF’s major business groups are classified by product shipped and include consumer
products, coal, industrial products and agricultural products. The following discussion compares BNSF’s results for the years
ending December 31, 2011, 2010 and 2009.
Revenues for the year ending December 31, 2011 were approximately $19.5 billion, representing an increase of
approximately $2.7 billion (16%) over 2010. Revenues from each of the four business groups increased between 8% and 19% as
compared to 2010. Overall, the increases in revenues in 2011 reflected a 12% increase in average revenues per car/unit across all
four business groups, as well as a 3% increase in the volume of cars/units handled. Revenues in each period include fuel
surcharges to customers under programs intended to recover incremental fuel costs when fuel prices exceed threshold fuel prices.
Average revenues per car/unit in 2011 included the effects of fuel surcharge increases of 35% in 2011 as compared to 2010.
The 3% increase in volume is comprised of increases of 7% in cars/units handled in the consumer products and industrial
products groups combined with a 4% decrease in volume for coal products. The consumer products volume increase was
attributable primarily to higher domestic intermodal and international volume. The decline in coal unit volume was partially
attributable to the impacts of severe flooding along key coal routes. Industrial products volume increased primarily as a result of
increased steel and sand shipments, as well as increased demand in petroleum products. Agricultural product volume remained
relatively unchanged, as higher wheat exports and U.S. corn shipments were mostly offset by declining soybean exports.
Operating expenses in 2011 were $14.2 billion, representing an increase of $1.9 billion (15%) over 2010. Fuel expenses
increased $1.3 billion in 2011 primarily due to higher fuel prices. The remainder of the increase in fuel costs was driven by
higher overall freight volumes and severe weather conditions, which negatively impacted efficiency. Compensation and benefits
expenses increased $311 million, reflecting volume-related costs, as well as salaries and benefits inflation, increased personnel
training costs and flood-related costs. Purchased services expenses increased $49 million due primarily to volume-related and
flood-related costs, offset by lower locomotive maintenance costs. In 2010, purchased services also included one-time merger-
related legal and consulting fees. Materials and other expenses increased $186 million, reflecting higher locomotive and freight
car material costs and increased crew transportation, travel and casualty costs offset by lower environmental costs.
Revenues for the year ending December 31, 2010 were approximately $16.9 billion, representing an increase of
approximately $2.8 billion (20%) over 2009. Revenues from each of the four business groups increased between 17% and 23%
as compared to 2009. The increases reflected increased volume as well as overall increased yields. In addition, annual revenues
in 2010 included an increase in fuel surcharges of $740 million as compared to 2009.
Operating expenses in 2010 were $12.4 billion, an increase of $1.6 billion (15%) over 2009, reflecting an increase in costs
to handle the increase in freight volume as well as higher fuel and wage costs. Fuel costs increased $644 million primarily due
to higher prices. Compensation and benefits expense increased $523 million in 2010 primarily due to increased incentive
compensation, increased health and welfare expenses and general wage increases. Operating expenses in 2010 also reflected
increased depreciation and amortization expense versus 2009.
70