Berkshire Hathaway 2011 Annual Report Download - page 73
Download and view the complete annual report
Please find page 73 of the 2011 Berkshire Hathaway annual report below. You can navigate through the pages in the report by either clicking on the pages listed below, or by using the keyword search tool below to find specific information within the annual report.-
 1
1 -
2
-
3
-
4
-
5
-
6
-
7
-
8
-
9
-
10
-
11
-
12
-
13
-
14
-
15
-
16
-
17
-
18
-
19
-
20
-
21
-
22
-
23
-
24
-
25
-
26
-
27
-
28
-
29
-
30
-
31
-
32
-
33
-
34
-
35
-
36
-
37
-
38
-
39
-
40
-
41
-
42
-
43
-
44
-
45
-
46
-
47
-
48
-
49
-
50
-
51
-
52
-
53
-
54
-
55
-
56
-
57
-
58
-
59
-
60
-
61
-
62
-
 63
63 -
 64
64 -
 65
65 -
 66
66 -
 67
67 -
 68
68 -
 69
69 -
 70
70 -
 71
71 -
 72
72 -
 73
73 -
 74
74 -
 75
75 -
 76
76 -
 77
77 -
 78
78 -
 79
79 -
 80
80 -
 81
81 -
 82
82 -
 83
83 -
84
-
85
-
86
-
87
-
88
-
89
-
90
-
91
-
92
-
93
-
94
-
95
-
96
-
97
-
98
-
99
-
100
-
101
-
102
-
103
-
104
-
105
 |
 |

Management’s Discussion (Continued)
Utilities and Energy (“MidAmerican”)
We hold an 89.8% ownership interest in MidAmerican Energy Holdings Company (“MidAmerican”), which operates an
international energy business. MidAmerican’s domestic regulated energy interests are comprised of two regulated utility
companies, PacifiCorp and MidAmerican Energy Company (“MEC”). MidAmerican also operates two interstate natural gas
pipeline companies. In the United Kingdom, MidAmerican operates two electricity distribution businesses, operating as
Northern Powergrid Holdings Company (“Northern Powergrid”). The rates that utility and natural gas pipeline companies
charge customers for energy and other services are generally subject to regulatory approval. Rates are based in large part on the
costs of business operations, including a return on capital. To the extent these operations are not allowed to include such costs in
the approved rates, operating results will be adversely affected. In addition, MidAmerican also operates a diversified portfolio of
independent power projects and the second-largest residential real estate brokerage firm in the United States.
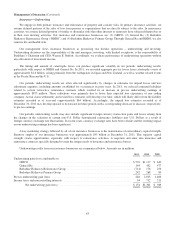
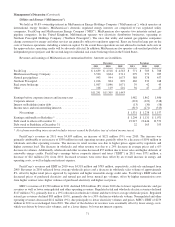
Revenues and earnings of MidAmerican are summarized below. Amounts are in millions.
Revenues Earnings
2011 2010 2009 2011 2010 2009
PacifiCorp ........................................... $ 4,639 $ 4,518 $ 4,543 $ 771 $ 783 $ 788
MidAmerican Energy Company .......................... 3,530 3,824 3,711 279 279 285
Natural gas pipelines ................................... 993 994 1,073 388 378 457
Northern Powergrid .................................... 1,016 804 829 469 333 248
Real estate brokerage .................................. 1,007 1,046 1,071 39 42 43
Other ............................................... 106 119 216 36 47 25
$11,291 $11,305 $11,443
Earnings before corporate interest and income taxes .......... 1,982 1,862 1,846
Corporate interest ..................................... (323) (323) (318)
Interest on Berkshire junior debt .......................... (13) (30) (58)
Income taxes and noncontrolling interests .................. (315) (271) (313)
Net earnings ...................................... $ 1,331 $ 1,238 $ 1,157
Earnings attributable to Berkshire * ....................... $ 1,204 $ 1,131 $ 1,071
Debt owed to others at December 31 ...................... 19,915 19,646 19,579
Debt owed to Berkshire at December 31 ................... 22 165 353
*Net of noncontrolling interests and includes interest earned by Berkshire (net of related income taxes).
PacifiCorp’s revenues in 2011 were $4,639 million, an increase of $121 million (3%) over 2010. The increase was
primarily attributable to an increase of $350 million in retail operating revenue, partially offset by a decrease of $196 million in
wholesale and other operating revenue. The increase in retail revenue was due to higher prices approved by regulators and
higher customer load. The decrease in wholesale and other revenue was due to a 24% decrease in average prices and a 6%
decrease in volumes. Additionally, wholesale and other revenue decreased $57 million due to lower sales and higher deferrals of
renewable energy credits. PacifiCorp’s earnings before corporate interest and taxes (“EBIT”) in 2011 were $771 million, a
decrease of $12 million (2%) from 2010. Increased revenues were more than offset by an overall increase in energy and
operating costs, as well as higher net interest expense.
PacifiCorp’s revenues and EBIT in 2010 were $4,518 million and $783 million, respectively, relatively unchanged from
2009. Revenues in 2010 reflected lower average wholesale prices and a decrease in wholesale sales volume of approximately
8%, offset by higher retail prices approved by regulators and higher renewable energy credit sales. PacifiCorp’s EBIT reflected
decreased prices of purchased electricity and natural gas and lower natural gas volumes, offset by higher transmission costs
from higher contract rates, higher volumes of purchased electricity and higher coal prices.
MEC’s revenues of $3,530 million in 2011 declined $294 million (8%) from 2010 due to lower regulated electric and gas
revenues as well as lower nonregulated and other operating revenues. Regulated retail and wholesale electric revenues declined
$117 million (7%), primarily due to a 19% reduction in wholesale volume and due to lower average wholesale prices. Regulated
natural gas revenues declined $83 million (10%), primarily due to a 30% decline in wholesale volume. Nonregulated and other
operating revenues decreased $112 million (9%), due principally to lower electricity volumes and prices. MEC’s EBIT of $279
million in 2011 was unchanged from 2010. The effect of the declines in revenues were essentially offset by lower energy costs,
which was driven by lower sales volumes, and to a lesser degree, by lower net interest expense.
71