Berkshire Hathaway 2011 Annual Report Download - page 61
Download and view the complete annual report
Please find page 61 of the 2011 Berkshire Hathaway annual report below. You can navigate through the pages in the report by either clicking on the pages listed below, or by using the keyword search tool below to find specific information within the annual report.-
 1
1 -
2
-
3
-
4
-
5
-
6
-
7
-
8
-
9
-
10
-
11
-
12
-
13
-
14
-
15
-
16
-
17
-
18
-
19
-
20
-
21
-
22
-
23
-
24
-
25
-
26
-
27
-
28
-
29
-
30
-
31
-
32
-
33
-
34
-
35
-
36
-
37
-
38
-
39
-
40
-
41
-
42
-
43
-
44
-
45
-
46
-
47
-
48
-
49
-
50
-
 51
51 -
 52
52 -
 53
53 -
 54
54 -
 55
55 -
 56
56 -
 57
57 -
 58
58 -
 59
59 -
 60
60 -
 61
61 -
 62
62 -
 63
63 -
 64
64 -
 65
65 -
 66
66 -
 67
67 -
 68
68 -
 69
69 -
 70
70 -
 71
71 -
72
-
73
-
74
-
75
-
76
-
77
-
78
-
79
-
80
-
81
-
82
-
83
-
84
-
85
-
86
-
87
-
88
-
89
-
90
-
91
-
92
-
93
-
94
-
95
-
96
-
97
-
98
-
99
-
100
-
101
-
102
-
103
-
104
-
105
 |
 |

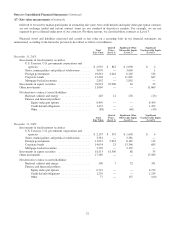
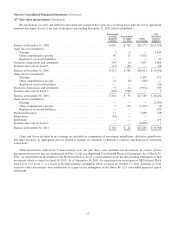
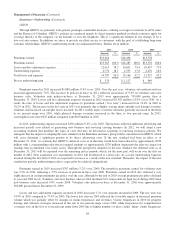
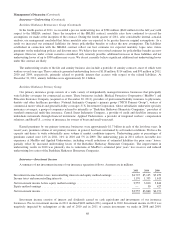
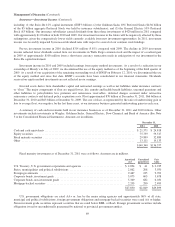
Notes to Consolidated Financial Statements (Continued)
(21) Business segment data (Continued)
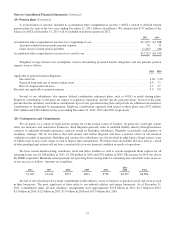
Other businesses not specifically identified with reportable business segments consist of a large, diverse group of
manufacturing, service and retailing businesses. A disaggregation of our consolidated data for each of the three most recent
years is presented in the tables which follow on this and the following two pages (in millions).
Revenues Earnings before income taxes
2011 2010 2009 2011 2010 2009
Operating Businesses:
Insurance group:
Underwriting:
GEICO ................................... $ 15,363 $ 14,283 $ 13,576 $ 576 $ 1,117 $ 649
General Re ................................ 5,816 5,693 5,829 144 452 477
Berkshire Hathaway Reinsurance Group ........ 9,147 9,076 6,706 (714) 176 250
Berkshire Hathaway Primary Group ............ 1,749 1,697 1,773 242 268 84
Investment income ............................. 4,746 5,186 5,509 4,725 5,145 5,459
Total insurance group ............................... 36,821 35,935 33,393 4,973 7,158 6,919
BNSF (1) .......................................... 19,548 15,059 — 4,741 3,611 —
Finance and financial products ........................ 4,014 4,264 4,301 774 689 653
Marmon .......................................... 6,925 5,967 5,067 992 813 686
McLane Company .................................. 33,279 32,687 31,207 370 369 344
MidAmerican ..................................... 11,291 11,305 11,443 1,659 1,539 1,528
Other businesses (2) ................................. 32,202 27,956 25,391 3,675 3,092 1,028
144,080 133,173 110,802 17,184 17,271 11,158
Reconciliation of segments to consolidated amount:
Investment and derivative gains/losses .............. (830) 2,346 787 (830) 2,346 787
Interest expense, not allocated to segments .......... — — — (221) (208) (101)
Eliminations and other .......................... 438 666 904 (819) (358) (292)
$143,688 $136,185 $112,493 $15,314 $19,051 $11,552
(1) From acquisition date of February 12, 2010.
(2) Includes Lubrizol from the acquisition date of September 16, 2011.
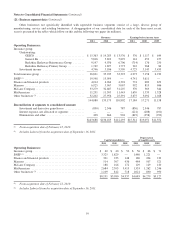
Capital expenditures
Depreciation
of tangible assets
2011 2010 2009 2011 2010 2009
Operating Businesses:
Insurance group ............................................. $ 40 $ 40 $ 50 $ 56 $ 66 $ 71
BNSF (1) ................................................... 3,325 1,829 — 1,480 1,221 —
Finance and financial products ................................. 331 233 148 180 204 219
Marmon ................................................... 514 307 436 484 507 521
McLane Company ........................................... 188 166 172 129 129 120
MidAmerican .............................................. 2,684 2,593 3,413 1,333 1,262 1,246
Other businesses (2) .......................................... 1,109 812 718 1,021 890 950
$8,191 $5,980 $4,937 $4,683 $4,279 $3,127
(1) From acquisition date of February 12, 2010.
(2) Includes Lubrizol from the acquisition date of September 16, 2011.
59