BMW 2011 Annual Report Download - page 91
Download and view the complete annual report
Please find page 91 of the 2011 BMW annual report below. You can navigate through the pages in the report by either clicking on the pages listed below, or by using the keyword search tool below to find specific information within the annual report.-
 1
1 -
2
-
3
-
4
-
5
-
6
-
7
-
8
-
9
-
10
-
11
-
12
-
13
-
14
-
15
-
16
-
17
-
18
-
19
-
20
-
21
-
22
-
23
-
24
-
25
-
26
-
27
-
28
-
29
-
30
-
31
-
32
-
33
-
34
-
35
-
36
-
37
-
38
-
39
-
40
-
41
-
42
-
43
-
44
-
45
-
46
-
47
-
48
-
49
-
50
-
51
-
52
-
53
-
54
-
55
-
56
-
57
-
58
-
59
-
60
-
61
-
62
-
63
-
64
-
65
-
66
-
67
-
68
-
69
-
70
-
71
-
72
-
73
-
74
-
75
-
76
-
77
-
78
-
79
-
80
-
 81
81 -
 82
82 -
 83
83 -
 84
84 -
 85
85 -
 86
86 -
 87
87 -
 88
88 -
 89
89 -
 90
90 -
 91
91 -
 92
92 -
 93
93 -
 94
94 -
 95
95 -
 96
96 -
 97
97 -
 98
98 -
 99
99 -
 100
100 -
 101
101 -
102
-
103
-
104
-
105
-
106
-
107
-
108
-
109
-
110
-
111
-
112
-
113
-
114
-
115
-
116
-
117
-
118
-
119
-
120
-
121
-
122
-
123
-
124
-
125
-
126
-
127
-
128
-
129
-
130
-
131
-
132
-
133
-
134
-
135
-
136
-
137
-
138
-
139
-
140
-
141
-
142
-
143
-
144
-
145
-
146
-
147
-
148
-
149
-
150
-
151
-
152
-
153
-
154
-
155
-
156
-
157
-
158
-
159
-
160
-
161
-
162
-
163
-
164
-
165
-
166
-
167
-
168
-
169
-
170
-
171
-
172
-
173
-
174
-
175
-
176
-
177
-
178
-
179
-
180
-
181
-
182
-
183
-
184
-
185
-
186
-
187
-
188
-
189
-
190
-
191
-
192
-
193
-
194
-
195
-
196
-
197
-
198
-
199
-
200
-
201
-
202
-
203
-
204
-
205
-
206
-
207
-
208
-
209
-
210
-
211
-
212
-
213
-
214
-
215
-
216
-
217
-
218
-
219
-
220
-
221
-
222
-
223
-
224
-
225
-
226
-
227
-
228
-
229
-
230
-
231
-
232
-
233
-
234
-
235
-
236
-
237
-
238
-
239
-
240
-
241
-
242
-
243
-
244
-
245
-
246
-
247
-
248
-
249
-
250
-
251
-
252
-
253
-
254
-
255
-
256
-
257
-
258
-
259
-
260
-
261
-
262
-
263
-
264
-
265
-
266
-
267
-
268
-
269
-
270
-
271
-
272
-
273
-
274
-
275
-
276
-
277
-
278
-
279
-
280
-
281
-
282
 |
 |
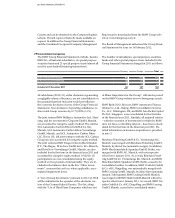
91 GROUP FINANCIAL STATEMENTS
assets, less the costs of disposal. The value in use corre-
sponds to the present value of future cash flows ex-
pected to be derived from an asset or groups of assets.
The first step of the impairment test is to determine the
value in use of an asset. If the calculated value in use
is lower than the carrying amount of the asset, then its
fair value less costs to sell are also determined. If the
latter is also lower than the carrying amount of the asset,
then an impairment loss is recorded, reducing the car-
rying amount to the higher of the asset’s value in use
or fair value less costs to sell. The value in use is deter-
mined on the basis of a present value computation.
Cash flows used for the purposes of this calculation are
derived from long-term forecasts approved by manage-
ment and which cover a planning period of six years.
The long-term forecasts themselves are based on de-
tailed forecasts drawn up at an operational level. For the
purposes of calculating cash flows beyond the planning
period, the asset’s assumed residual value does not
take growth into account. Forecasting assumptions are
continually brought up to date and take account of eco-
nomic developments and past experience. Cash flows
of
the Automotive and Motorcycles CGUs are discounted
using a risk-adjusted pre-tax cost of capital (WACC) of
12.0 %. In the case of the Financial Services CGU, a pre-
tax cost of equity capital of 12.7 % (customary for the
sector) is used.
If the reason for a previously recognised impairment
loss no longer exists, the impairment loss is reversed up
to the level of the recoverable amount, capped at the
level of rolled-forward amortised cost. This does not ap-
ply to goodwill: previously recognised impairment losses
on goodwill are not reversed.
Investments accounted for using the equity method are
(except when the investment is impaired) measured at
the Group’s share of equity taking account of fair value
adjustments on acquisition.
Investments in non-consolidated Group companies re-
ported in other investments are measured at cost or, if
lower, at their fair value.
Participations are measured at their quoted market
price or fair value. When, in individual cases, these val-
ues are not available or cannot be determined reliably,
participations are measured at cost.
Non-current marketable securities are measured ac-
cording to the category of financial asset to which they
are classified. No held-for-trading financial assets are in-
cluded under this heading.
A financial instrument is a contract that gives rise to a
financial asset of one entity and a financial liability
or equity instrument of another entity. Once the BMW
Group becomes party to such to a contract, the financial
instrument is recognised either as a financial asset or as
a financial liability.
Financial assets are accounted for on the basis of the
settlement date. On initial recognition, they are measured
at their fair value. Transaction costs are included in the
fair value unless the financial assets are allocated to the
category “financial assets measured at fair value
through profit or loss”.
Subsequent to initial recognition, available-for-sale and
held-for-trading financial assets are measured at their
fair value. When market prices are not available, the fair
value of available-for-sale financial assets is measured
using appropriate valuation techniques e. g. discounted
cash flow analysis based on market information available
at the balance sheet date.
Available-for-sale assets include financial assets, securi-
ties and investment fund shares. This category includes
all non-derivative financial assets which are not classi-
fied as “loans and receivables” or “held-to-maturity in-
vestments” or as items measured “at fair value through
profit and loss”.
Loans and receivables which are not held for trading
and held-to-maturity financial investments with a fixed
term are measured at amortised cost using the effective
interest method. All financial assets for which published
price quotations in an active market are not available
and whose fair value cannot be determined reliably are
required to be measured at cost.
In accordance with IAS 39 (Financial Instruments:
Recognition and Measurement), assessments are made
regularly as to whether there is any objective evidence
that a financial asset or group of assets may be im-
paired. Impairment losses identified after carrying out
an impairment test are recognised as an expense. Gains
and losses on available-for-sale financial assets are